Build Log Analyzer
Build Log Analyzer analyzes information provided in MSBuild log files. It provides a graphical user interface that displays the compile and link times for your title on a timeline. The timeline allows you to see the order in which your files were built, the time each compile and link action took, the amount of parallelism in your build and so forth. The Build Log Analyzer examines the switches you are passing to the compiler and linker and recommends best practices you can apply to optimize your build and runtime performance.
While this release of the Build Log Analyzer only provides full analysis of log files generated by MSBuild, a subset of features also work for log files generated by other build systems including Unreal Engine.
We are very interested in your feedback on Build Log Analyzer and the optimization scenarios you are most interested in seeing it support. Please provide your comments by sending email to blafeedback@microsoft.com, or by contacting your Microsoft Representative.
Preparing to use the Build Log Analyzer
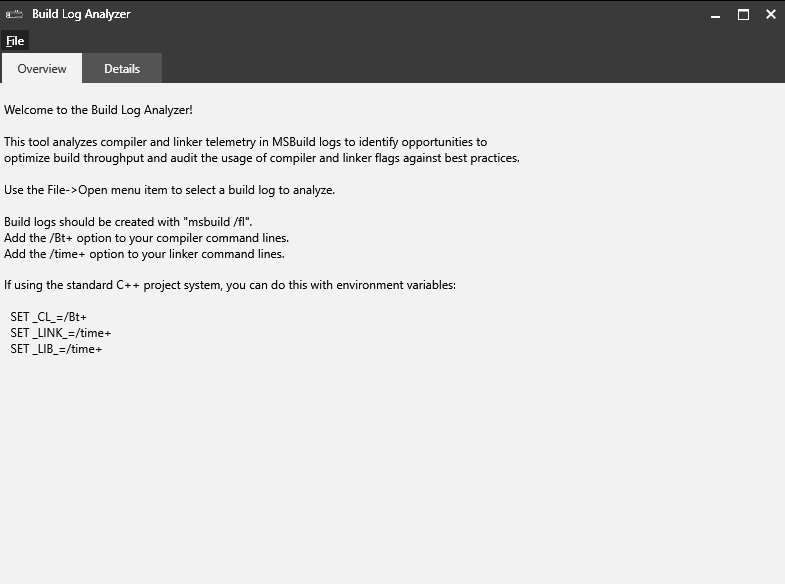
Build Log Analyzer analyzes information provided in MSBuild log files, so you must first ensure your build generates a log file containing the right compiler and linker events. This involves the following steps:
- Set the following environment variables before building:
SET _CL_=/Bt+ SET _LINK_=/time+ SET _LIB_=/time+ - Build with an MSBuild file logger by adding the /fl switch to your MSBuild command line.
By default, the resulting build log file will be named ‘msbuild.log’ and it can be found in the current directory from which you invoked msbuild.exe.
Using Build Log Analyzer Interactively
To analyze a build file interactively, use the File -> Open menu item in Build Log Analyzer’s main window to open your log file. Once a log file as been opened, the Build Log Analyzer contains two tabs: an Overview tab and a Details tab.
Overview Tab
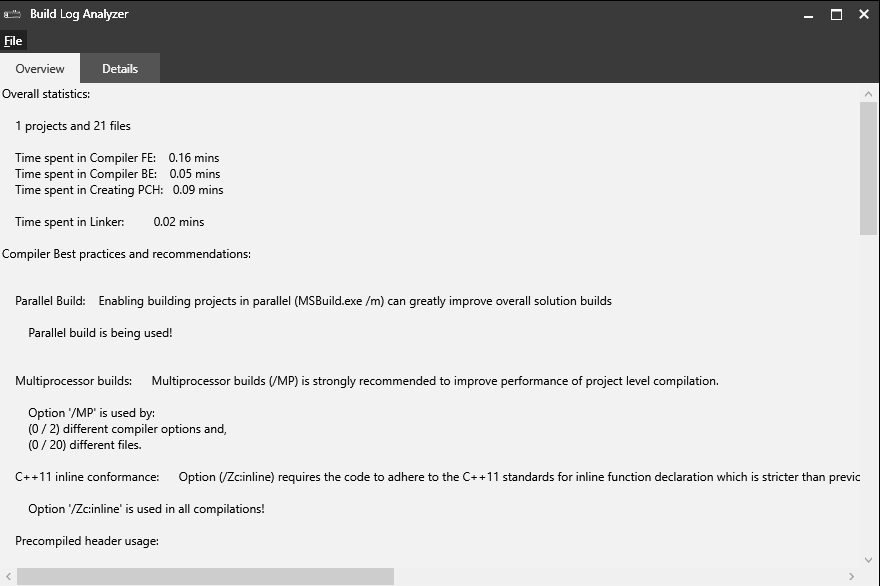
The Overview tab presents statistics about your build and provides a set of recommendations based on the set of switches that you’ve passed to the compiler and linker. These recommendations provide suggestions both for reducing your build time and for improving the code generated by the compiler and linker.
Details Tab
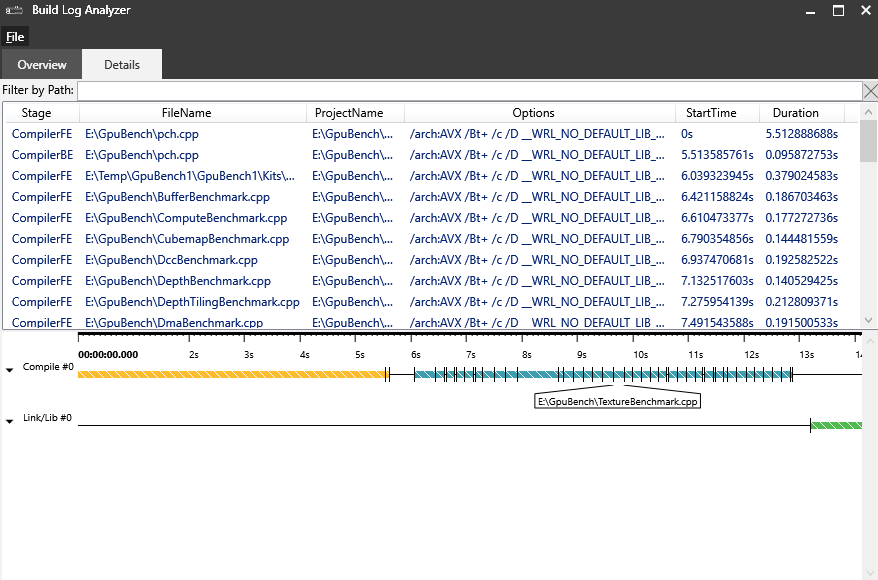
The Details tab displays the full list of all files that were compiled and linked in time order. For each file, Build Log Analyzer displays the build duration, start and stop time, the project the file is a part of and the set of switches passed to the compiler and linker. A graphical timeline is also shown. The list of files and the timline are linked. Clicking on a row in the table selects the corresponding event in the timeline and vice versa. Different types of events are shown in different colors on the timeline. Processing of precompiled headers is shown in orange, compilation of .c and .cpp are shown in blue and link times are shown in green. Sort and filter the rows in the event list, select one or more rows, right-click on your selection, and choose Copy Data to copy data for the selected events to the clipboard in CSV format.
Log Tab
The log tab displays the complete contents of the build log that was provided for analysis. You can right-click an event in the Details Tab, choose View in Log, and the corresponding line from the build log will be highlighted in the Log Tab.
Using Build Log Analyzer from the Command Line
Build Log Analyzer can be run from the command line. For interactive use, you can specify a build log file to be automatically analyzed when the Build Log Analyzer is shown. For silent operation (e.g., in build or test automation scenarios) you can specify the build log file to analyze, names to use for exported build event and analysis report files, and the /s switch to prevent the UI from being shown.
buildloganalyzer.exe [<logfile>] [/exportcsv <csvfile>] [/exportreport <reportfile>] [/s]

/exportcsv     Optionally generate a CSV-formatted file containing the build events identified by the log analyzer.
/exportreport  Optionally generate a text-formatted file containing the report resulting from analysis of the log file.
/s             Run silently; prevent UI from being shown.
logfile        Name of build log file to be analyzed.
csvfile        Name of file where CSV-formatted build events will be exported. Follows '/exportcsv' flag.
reportfile     Name of file where text-formatted analysis report will be exported. Follows '/exportreport' flag.