Getting Started with Debugging UWP Apps on Windows 10
By: Charles Sanglimsuwan, Advanced Technology Group
Published: May 26, 2016
In this topic
PLMDebug
Introduction
Compared to traditional desktop applications, debugging UWP apps requires a few additional configuration steps. This article provides a quick introduction to the official options that developers have for debugging UWP apps, as well as the steps required to use these tools.
With the advent of Windows 10 and the Universal Windows Platform (UWP), Microsoft makes available a number of tools to help developers create the best experiences on the UWP. Visual Studio 2015 and other debuggers, such as WinDbg, can be used to help isolate issues that occur during your app’s runtime on the UWP.
Compared to traditional desktop applications, debugging UWP apps requires a few additional configuration steps. This article provides a quick introduction to the official options that developers have for debugging UWP apps, as well as the steps required to use these tools.
Visual Studio 2015
The built-in debugger in Visual Studio 2015 can help developers investigate potential issues when using UWP-exclusive features. For example, one of the key differences between UWP apps and traditional desktop applications is that UWP titles reside in an app container subject to Process Lifecycle Management (PLM). UWP apps can be suspended, resumed, or terminated across all platforms by the Runtime Broker service.
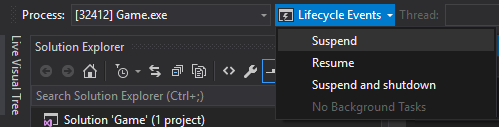
You can force your application into different PLM states by using the Lifecycle Events toolbar, which becomes visible when you run and debug your title.
Figure 1. Lifecycle Events toolbar.
Visual Studio can also attach to any running UWP app process by selecting Debug, and then Attach to Process. Attaching to a running process doesn’t require the original Visual Studio project, but symbols will help significantly (discussed later in this article).
In addition, any installed app package can be attached and debugged by selecting Debug, Other, and then Debug Installed App Packages.
Figure 2. Debug Installed App Package dialog box.
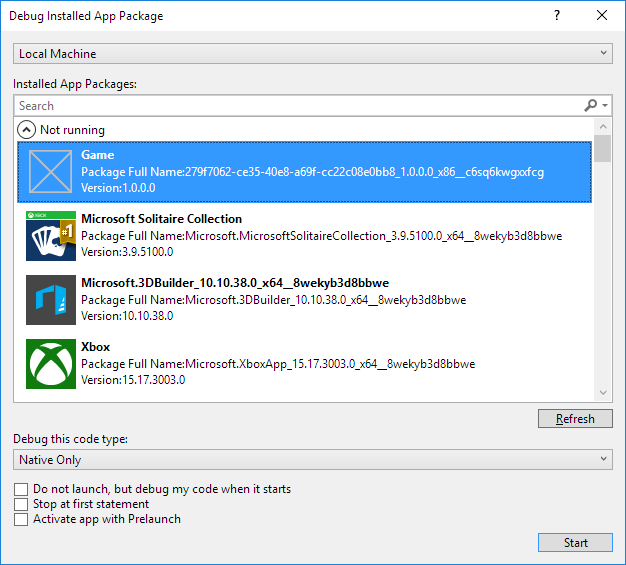
Selecting Do not launch, but debug my code when it starts will cause the Visual Studio debugger to attach to your UWP app when you launch it at a custom time. This is an effective way to debug control paths from different launch methods, such as protocol activation with custom parameters.
UWP titles can be developed and compiled on Windows 8.1 or later, but require Windows 10 to run. If you are developing a UWP app on a Windows 8.1 PC, you can remotely debug a UWP app running on another Windows 10 desktop PC, provided that both the host and target computer are under the same LAN. To do this, download and install the Remote Tools for Visual Studio on both workstations. The installed version must match the existing version of Visual Studio that you have installed, and the architecture you select (x86, x64) must also match that of your target application.
PLMDebug
PLMDebug.exe is a command-line tool that allows you to control the PLM state of an application package, and is shipped as part of the Windows SDK. After it is installed, the tool resides in C:\Program Files (x86)\Windows Kits\10\Debuggers\x64 by default.
PLMDebug also allows you to disable PLM for any installed app package, which is necessary for some debuggers. Disabling PLM prevents the Runtime Broker service from terminating your app before you have a chance to debug. To disable PLM, use the /enableDebug switch, followed by the full package name of your UWP app (the short name, package family name, or AUMID of a package will not work):
plmdebug /enableDebug [PackageFullName]
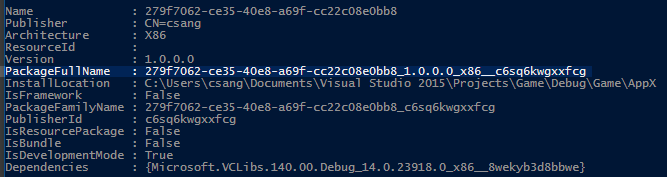
After deploying your UWP app from Visual Studio, the full package name is displayed in the output window. Alternatively, you can also retrieve the full package name by running Get-AppxPackage in a PowerShell console.
Figure 3. Running Get-AppxPackage.
Optionally, you can specify an absolute path to a debugger that will automatically launch when your app package is activated. If you wish to do this using Visual Studio, you’ll need to specify VSJITDebugger.exe as the debugger. However, VSJITDebugger.exe requires that you specify the “-p” switch, along with the process ID (PID) of the UWP app. Because it’s not possible to know the PID of your UWP app beforehand, this scenario is not possible out of the box.
You can work around this limitation by writing a script or tool that identifies your game’s process, and then the shell runs VSJITDebugger.exe, passing in the PID of your UWP app. The following C# code sample illustrates a straightforward approach to accomplish this.
using System.Diagnostics;

namespace VSJITLauncher
{
    class Program
    {
        static void Main(string[] args)
        {
            // Name of UWP process, which can be retrieved via Task Manager.
            Process[] processes = Process.GetProcessesByName(args[0]);

            // Get PID of most recent instance
            // Note the highest PID is arbitrary. Windows may recycle or wrap the PID at any time.
            int highestId = 0;
            foreach (Process detectedProcess in processes)
            {
                if (detectedProcess.Id > highestId)
                    highestId = detectedProcess.Id;
            }

            // Launch VSJITDebugger.exe, which resides in C:\Windows\System32
            ProcessStartInfo startInfo = new ProcessStartInfo("vsjitdebugger.exe", "-p " + highestId);
            startInfo.UseShellExecute = true;

            Process process = new Process();
            process.StartInfo = startInfo;
            process.Start();
        }
    }
}
Example usage of this in conjunction with PLMDebug:
plmdebug /enableDebug 279f7062-ce35-40e8-a69f-cc22c08e0bb8_1.0.0.0_x86__c6sq6kwgxxfcg "\"C:\VSJITLauncher.exe\" Game"
where “Game” is the process name, and “279f7062-ce35-40e8-a69f-cc22c08e0bb8_1.0.0.0_x86__c6sq6kwgxxfcg” is the full package name of the example UWP app package.
A compiled version of VSJITLauncher is included in the appendix of this article.
Note that every call to /enableDebug must be later coupled to another PLMDebug call with the /disableDebug switch. Furthermore, the path to a debugger must be absolute (relative paths are not supported).
WinDbg
WinDbg is a powerful debugger that is shipped as part of the Debugging Tools for Windows suite, which is included in the Windows SDK. The Windows SDK installation allows you to install Debugging Tools for Windows as a standalone product.
To use WinDbg with UWP apps, you will need to first disable PLM for your app package by using PLMDebug, as described in the previous section.
plmdebug /enableDebug [PackageFullName] "\"C:\Program Files\Debugging Tools for Windows (x64)\WinDbg.exe\" -server npipe:pipe=test"
In contrast to Visual Studio, most of the core functionality of WinDbg relies on providing commands to the command window. The provided commands allow you to view execution state, investigate user mode crash dumps, and debug in a variety of modes.
One of the most popular commands in WinDbg is !analyze -v, which is used to retrieve a verbose amount of information about the current exception, including:
-
FAULTING_IP: instruction pointer at the time of fault
-
EXCEPTION_RECORD: address, code, and flags of the current exception
-
STACK_TEXT: stack trace prior to exception
While highly useful for debugging native code, we don’t recommend WinDbg for apps written in managed code or HTML5. For a complete list of all WinDbg commands, see Debugger Commands.
Symbols
Symbol files contain a variety of very useful data when debugging code, such as variables, function names, and entry point addresses, allowing you to better understand exceptions and callstack execution order. Symbols for most variants of Windows are available through the Microsoft Symbol Server or can be downloaded for faster, offline lookups at Download Windows Symbol Packages.
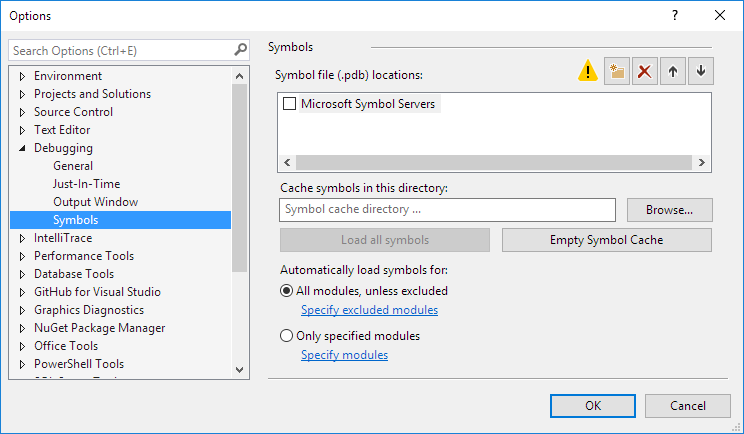
To set symbol options for Visual Studio, select Tools > Options, and then navigate to Debugging > Symbols in the dialog window.
Figure 4. Options dialog box.
To load symbols in a debugging session with WinDbg, set the sympath variable to the symbol package location. For example, running the following command will load symbols from the Microsoft Symbol Server, and then cache them in the C:\Symbols directory:
    .sympath SRV*C:\Symbols*http://msdl.microsoft.com/download/symbols
    .reload
You can add more paths by using the ‘;’ delimiter, or use the .sympath+ command. For more advanced symbol operations that use WinDbg, see Public and Private Symbols.
Summary
Developers building UWP apps or games have a versatile toolset to debug and isolate undesired behavior. Visual Studio 2015 has a comprehensive feature set to debug your app launched from different activation methods. Native code projects can also benefit from utilizing WinDbg to augment existing debugging solutions.