Extending Profiling with ETW on Xbox One
Event Tracing for Windows (ETW) is the standard, high-performance, profiling mechanism on desktop Windows. You may already be familiar with using the Xbox One built-in event providers and sampling profiler to assist you in your performance investigations using tools like xbperf and tracelog. However, authoring your own event providers, and combining them with recently-added features in Windows Performance Analyzer (WPA) can bridge the gap between ETW captures and the information available in PIX.
Note While using this topic, also see Custom Event Provider, a sample available for download from Samples on the Xbox Game Developer site. This topic is also available for download as a white paper, “Extending Profiling with ETW on Xbox One,” available on White Papers.
Introduction
ETW is the built-in logging system for Windows. If you’ve used tracelog, or xperf, or even the system Event Viewer then you’ve implicitly used ETW. On Xbox One, ETW complements PIX by allowing developers to capture information about process and thread activity, system tasks, and to collect data from the sampling profiler.
Applications and device drivers on desktop Windows are able to create their own event providers that can emit events to be consumed by existing tools such as WPA, or by custom domain-specific analyzers. While the process differs in a number of respects from the desktop Windows case, Exclusive partition titles can also create event providers that emit title-specific events into the ETL files captured by tracelog or xbperf. These events can allow you to better correlate title state, such as scene complexity, with specific performance scenarios.
You define your custom event providers using an XML manifest that is compiled into a header and a resource file using the message compiler that ships as part of the Visual Studio distribution. The resource file contains localized text resources for the events you have created, while the header defines helper macros for registering or unregistering your event provider and emitting your custom events.
The final stage of developing a desktop Windows event provider is to add it to the registry. This allows human-readable information about events (such as name and purpose) to be resolved from the provider GUID and the binary data stored in an ETL file. This registration is what powers the merge operation that is typically applied to ETL files after they have been acquired. On desktop Windows, you add and remove providers from the registry using the wevtutil.exe command. Xbox One takes a different approach as wevtutil.exe is not available in the Exclusive partition; you register the event provider on the development PC and do an additional merge step there (using xperf.exe) to resolve title-specific ETW data.
The following sections describe the process of creating and using event providers on Xbox One in more detail.
Adding a custom event provider to a title
Event provider manifests can be authored by hand—you can find the schema that describes their structure in include\um\eventman.xsd if you have the Windows SDK installed—but it is generally easier to use the ecmangen.exe tool. This is included in both the Visual Studio distribution and the full Windows SDK.
Figure 1. An Event Provider manifest loaded into ecmangen
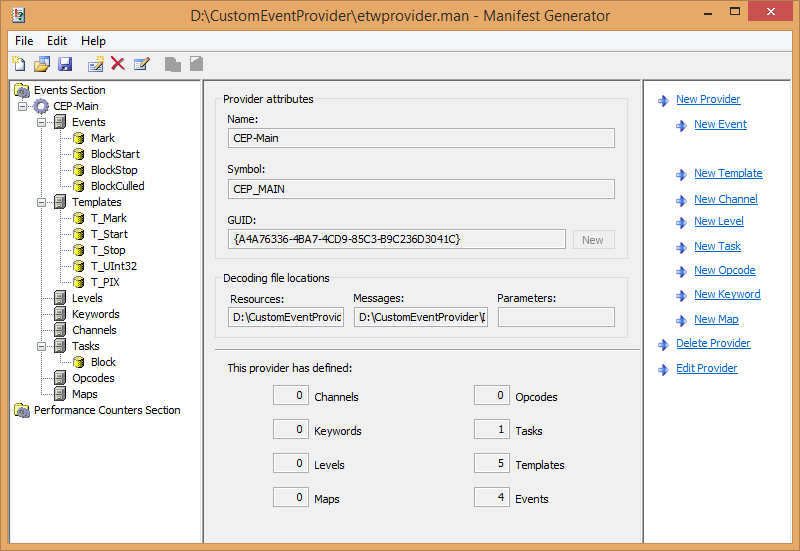
All events contain both a task field and an opcode field. You can consider the task to be the major activity (for example, reading a file) and the opcode to be the stage within that activity (open, read, and close in the case of reading a file). In addition, an event can have a template that describes the data that is associated with the event. In the case of the “open” opcode of the file reading task, the template might specify a Unicode string containing path to the file that was opened; in the case of the “read” opcode the template might specify a UINT32 for the number of bytes to be read.
Figure 2. Template definition that indicates an event and includes a single UInt32
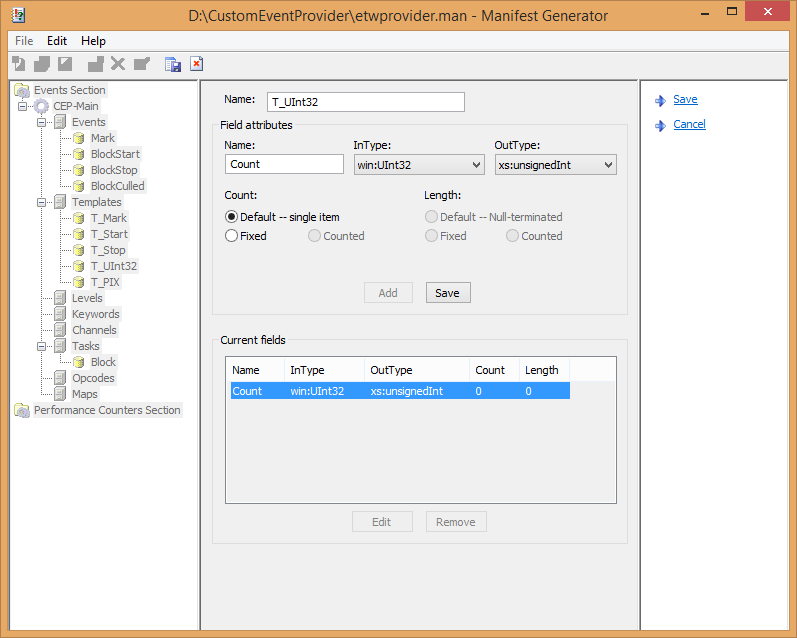
In the sample application, four event types are defined: a Mark event that takes a Unicode string as a parameter, a BlockCulled event that takes a single UINT32 parameter, a BlockStart event, and a BlockStop event. Rather than define custom opcodes for these events, you are free to use system opcodes present in the “win” namespace (in this case, win:Start for BlockStart, win:Stop for BlockStop, and win:Info for both Mark and BlockCulled).
Figure 3. Definition of a single event with its ID, Task, Opcode and template
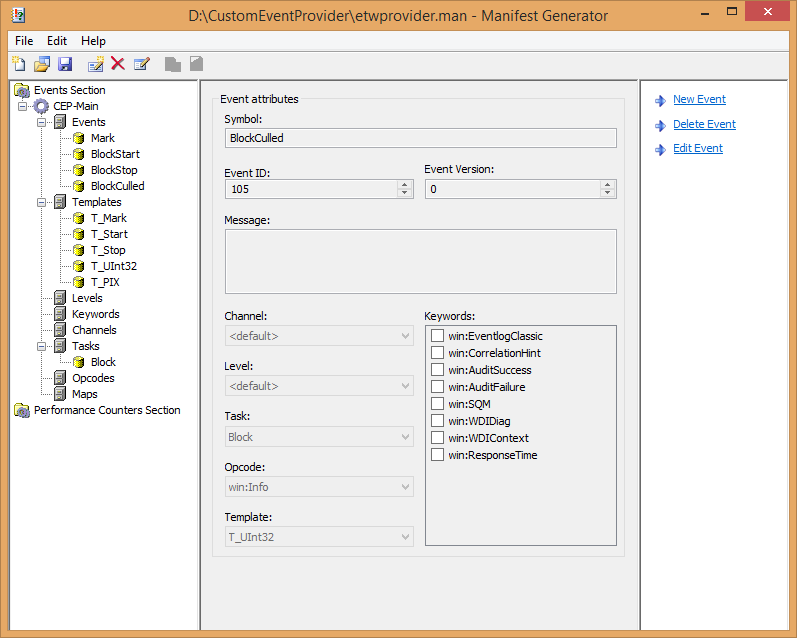
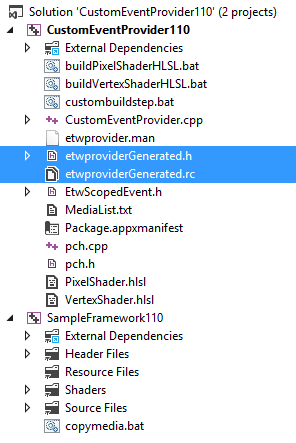
The event provider manifest is compiled into a header (etwproviderGenerated.h) and a resource file (etwproviderGenerated.rc) using the message compiler included with Visual Studio.
mc.exe -um etwprovider.man -z etwproviderGenerated
Both the generated header and resource file are included in the CustomEventProvider project.
Figure 4. Compiling the provider manifest (etwprovider.man) produces both a header and a resource file
Due to differences between the build environment for desktop Windows and the Xbox One Exclusive partition, it’s currently necessary to include the following code before including the generated header.
  #ifndef _TRACEHANDLE_DEFINED
  #define _TRACEHANDLE_DEFINED
  typedef ULONG64 TRACEHANDLE, *PTRACEHANDLE;
  #endif  // !_TRACEHANDLE_DEFINED

  #ifndef EVENT_CONTROL_CODE_DISABLE_PROVIDER
  #define EVENT_CONTROL_CODE_DISABLE_PROVIDER 0
  #endif // !EVENT_CONTROL_CODE_DISABLE_PROVIDER

  #ifndef EVENT_CONTROL_CODE_ENABLE_PROVIDER
  #define EVENT_CONTROL_CODE_ENABLE_PROVIDER  1
  #endif // !EVENT_CONTROL_CODE_ENABLE_PROVIDER

  #ifndef EVENT_CONTROL_CODE_CAPTURE_STATE
  #define EVENT_CONTROL_CODE_CAPTURE_STATE    2
  #endif // !EVENT_CONTROL_CODE_CAPTURE_STATE
The event provider must be registered before events can be emitted, and should be unregistered when the title terminates. The generated header defines the EventRegisterCEP_Main and EventUnregisterCEP_Main macros to facilitate this. Once registered, events can be emitted using a dedicated macro for each event type (parameters will vary according to the specific payload of the event).
  EventWriteMark(Description)
  EventWriteBlockStart(CpuID, Seq, Tag)
  EventWriteBlockStop(CpuID, Seq, Tag)
  EventWriteBlockCulled(Count)
Capturing custom events using tracelog
Since a custom event provider cannot be added to the registry in the Exclusive partition, you need to refer to it by its GUID. As a result it’s necessary to use tracelog.exe to capture events, since xbperf doesn’t have provision to specify providers by GUID.
The example that follows shows how to create a capture session “CustomSession” that will capture some system activity and data from the sampling profiler, in addition to events emitted by the custom provider. Note how the GUID matches the provider GUID specified in the manifest (see Figure 1).
xbrun /x/title /O tracelog -start CustomSession -f d:\custom03.etl -eflag PROC_THREAD+LOADER+DPC+INTERRUPT+CSWITCH+PROFILE -guid #{A4A76336-4BA7-4CD9-85C3-B9C236D3041C} -stackwalk PROFILE+CSWITCH
Once the capture session is complete, it can be stopped in the usual way.
xbrun /x/title /O tracelog -stop CustomSession
Merge the captured ETL file on the devkit which will convert the binary data from the system providers into a more human-friendly form. The data for our custom provider will not be modified, however; because the provider isn’t in the registry, this information is unavailable.
xbrun /x/title /O tracelog -merge d:\custom03.etl d:\custom03_merge.etl
The merged file can be copied back to the development PC and loaded into WPA.
xbcp /x/title xd:\custom03_merge.etl
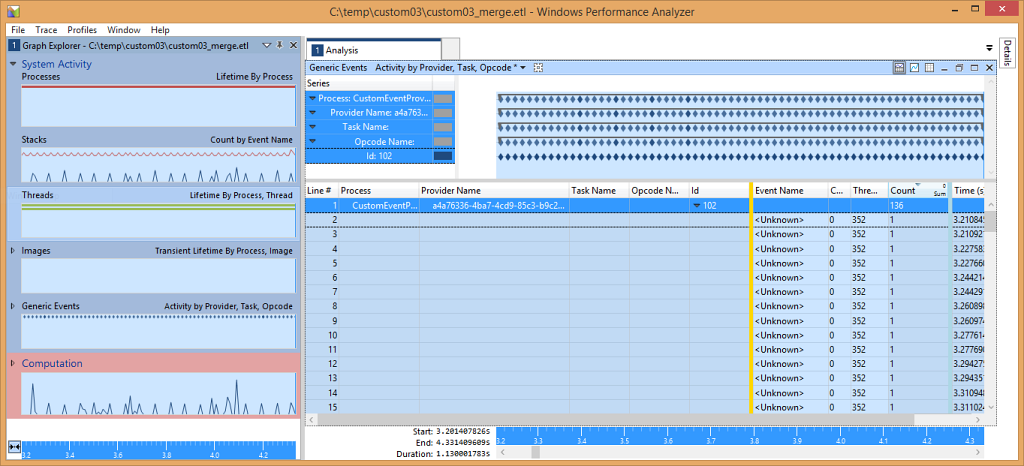
Custom events appear in the Generic Events graph within the System Activity group. Without the additional data provided by a merge, you will only see the provider GUID. Useful information like Task Name and Opcode Name will not be visible. The per-event custom data won’t be visible either.
Figure 5. ETL_file_custom_events_in_WPA.png
Resolving custom events on the development PC
In order to display the full information for each custom event, register the event provider on the development PC, rather than on the devkit, and resolve the events there.
First, edit the provider node of the event manifest (evtprovider.man) and make sure that the resourceFileName and messageFileName attributes point at the location on your development PC where the Xbox One executable is built.
  <provider name="CEP-Main" guid="{A4A76336-4BA7-4CD9-85C3-B9C236D3041C}"
symbol="CEP_MAIN"
  resourceFileName="D:\CustomEventProvider\Durango\Debug110\bin\CustomEventProvider110Debug.exe"
  messageFileName="D:\CustomEventProvider\Durango\Debug110\bin\CustomEventProvider110Debug.exe">
Next, register the event provider on your host PC by running the wevtutil.exe tool from an elevated command prompt.
wevtutil.exe im etwprovider.man
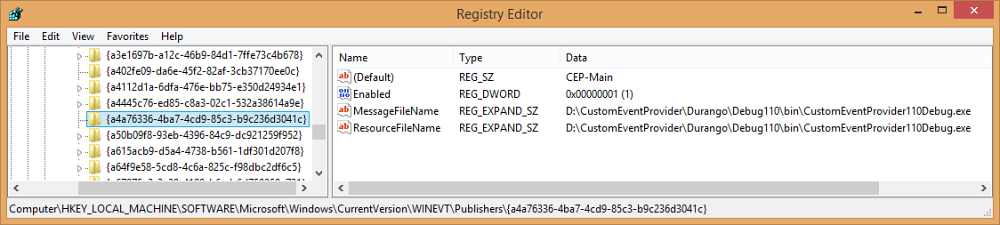
If you check in the registry on your host PC, you should see the provider listed under HKLM\SOFTWARE\Microsoft\Windows\CurrentVersion\WINEVT\Publishers. The MessageFileName and ResourceFileName entries must point at the Xbox One executable.
Figure 6. Event manifest after being added to the registry
Finally, resolve the ETL file on your host PC using xperf.exe, which ships as part of the Windows Performance Toolkit in the Windows SDK.
xperf.exe -merge custom03_merge.etl custom03_merge_host.etl
If the host merged ETL file is loaded into WPA you should now see the events correctly resolved. The Task, Opcode, and custom payload are now all visible.
Figure 7. An ETL file with custom event providers after a final merge
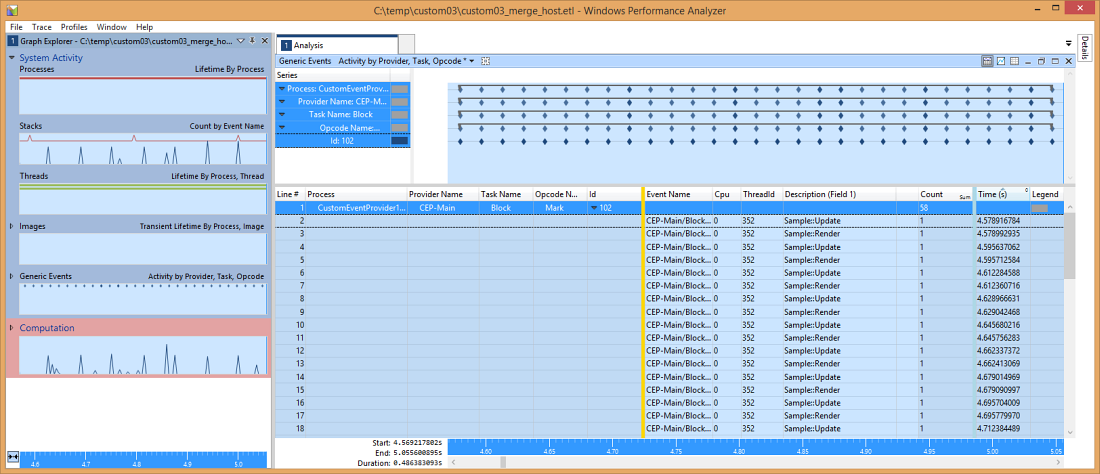
Note how the Description (Field 1) column now contains the strings that were logged with the events in addition to the Task and Opcode names.
When you have finished your performance analysis session, you can remove the provider from your host PC.
wevtutil.exe um etwprovider.man
It is important to note that event providers are identified by GUID during the merge process. If you inadvertently register an event provider on your development PC that has a different structure to the one used for the capture then undefined behavior will result. It is recommended that you generate a new GUID when the internal structure of an event provider changes, and register and unregister the event provider around the merge operation on the development PC so stale data is never present in the registry. Once the merge has been successfully performed, of course, the event structure is locked into the output ETL file and changes to the event manifest will have no effect.
If you are wondering whether it is possible to graph a numeric field from a custom event, the answer is currently “No”. You can only view the value of fields from custom events in the table view. It is, however, possible to use custom events to generate timeline information using Regions of Interest as discussed later in this white paper. This allows you to generate information similar to PIX bracketing in a form that’s compatible with WPA.
Regions of Interest
WPA supports the concept of Regions of Interest (ROI). ROI is the capability to denote and label temporal ranges within a capture. The EtwScopedEvent class and ETWScopedEvent macro in the sample demonstrate how, with the appropriate payload, ROI can be used to provide bracketing functionality analogous to the PIXBeginEvent and PIXEndEvent functions.
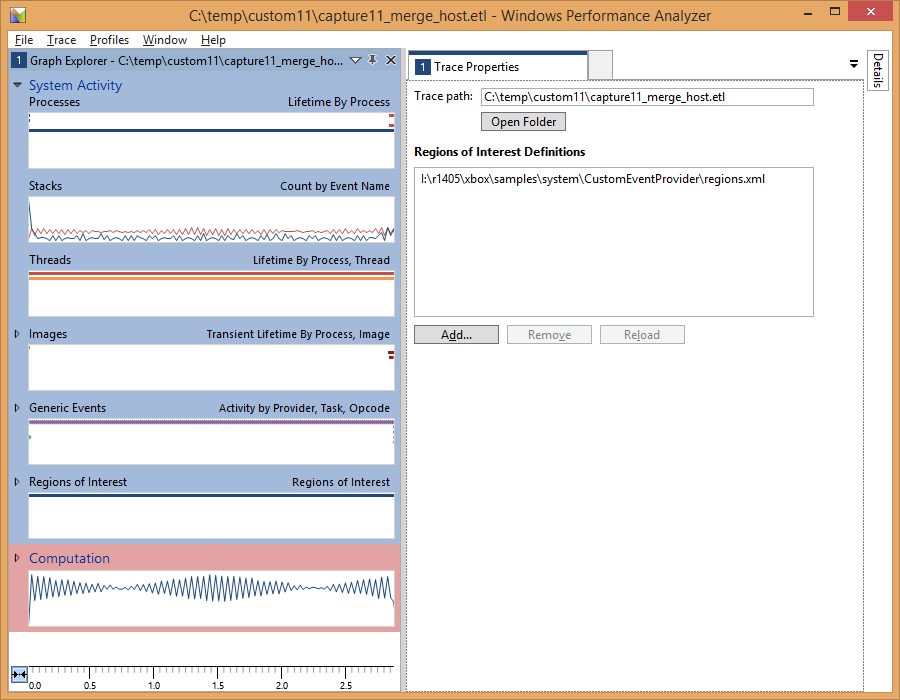
To show ROI in an ETL capture you will first need to load the region definition file. From the Trace menu choose Trace Properties and then load the regions.xml definition that ships with the sample.
Figure 8. Trace properties allow region definitions to be associated with an ETL file
You should now see the Regions of Interest graph available under the Generic Events graph. Drag the ROI graph over to the analysis area to expand it; the default view preset (on the toolbar) should be Regions of Interest. Add the Region column to the table to the left of the divider, so that you can pivot on it and each region gets a unique color. Then expand the Root node and you should see a display similar to what is shown in Figure 9. The sample creates a separate region for the activity of each CPU core.
Figure 9. Regions of Interest display
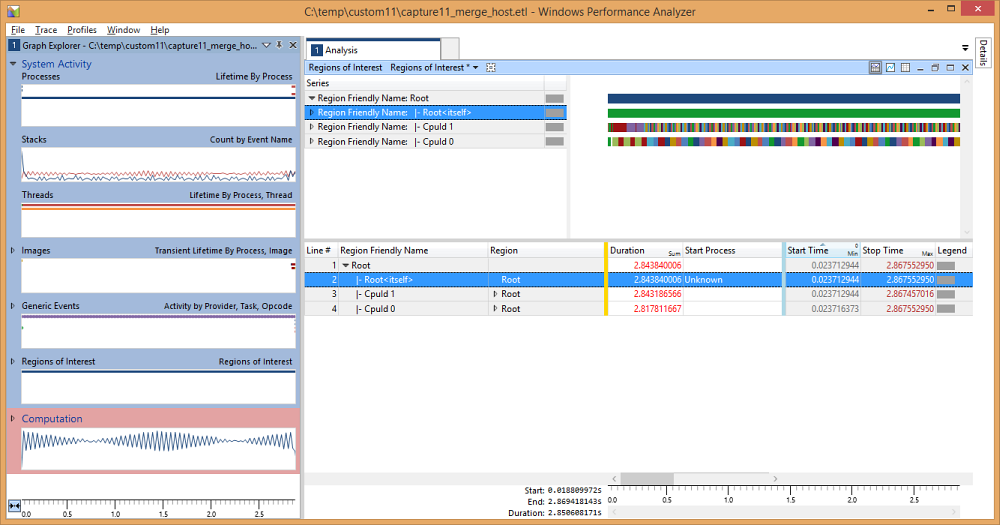
Expanding the Region nodes of the table will give you information on the individual brackets. Expanding the node for CpuId 1 shows the individual regions that were detected, along with the tags associated with them.
Figure 10. The Region nodes of the table give information about the individual brackets
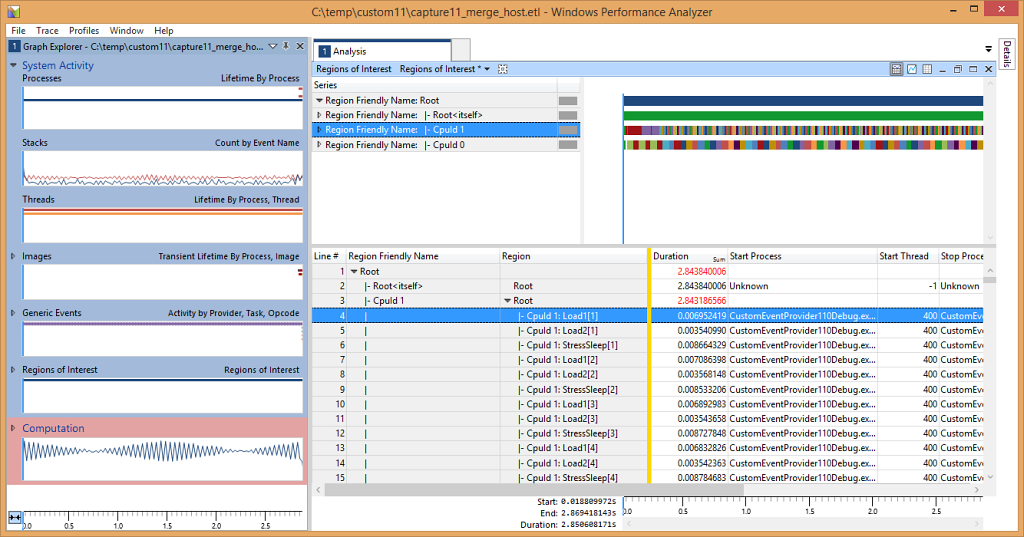
As you can see in Figure 10, the labels that were provided in the calls to the ETWScopedEvent macro are visible here—the number is the instance of a particular label.
Expanding the graph will show each region’s timeline separately.
Figure 11. Expanded timeline for a particular Region of Interest
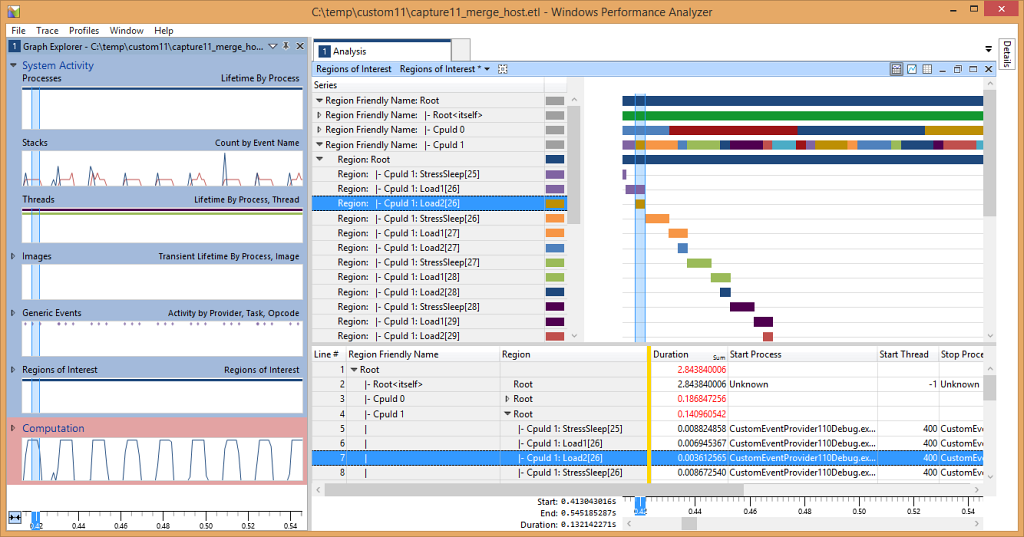
You can now correlate regions with data from a sampling capture, assuming you had it enabled. When data from the sampling profiler is present, you can directly correlate CPU activity with the regions.
Figure 12. Sampling capture
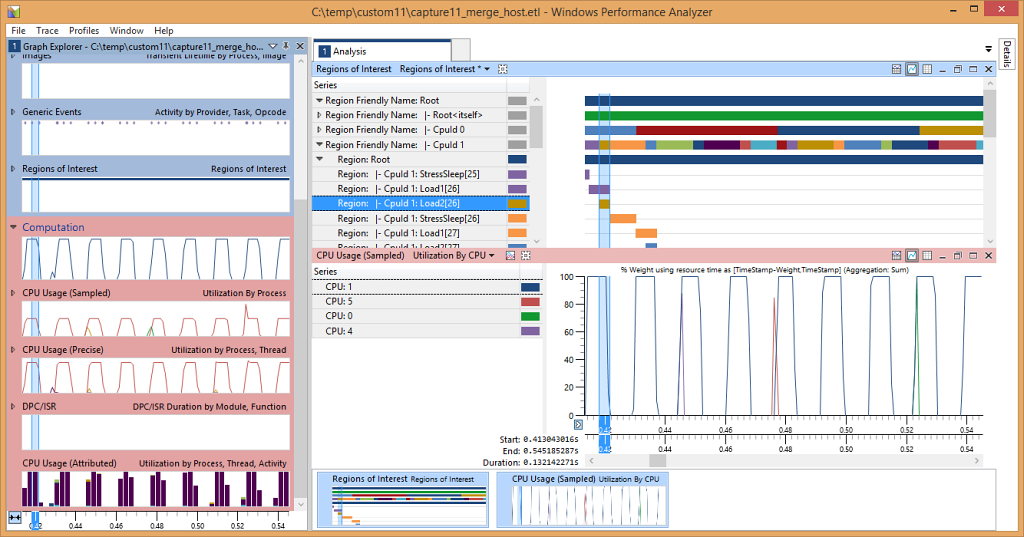
ROI works by allowing pairs of events to denote the start and end of a region on the timeline; the region definition file specifies which event pairs denote which region. Here’s a fragment of the region definition file from the sample.
  <?xml version='1.0' encoding='utf-8' standalone='yes'?>
  <InstrumentationManifest xmlns:xsi="http://www.w3.org/2001/XMLSchema-instance" xmlns:xs="http://www.w3.org/2001/XMLSchema" >
    <Instrumentation>
      <Regions>
        <RegionRoot Guid="{2A84A8DD-27E7-4972-B7F9-C521A10610BD}"
             Name="Sample Region File Root"
             FriendlyName="Root">

          <Region Guid="{0820756B-5763-4214-B9C8-AEC5272593C7}"
               Name="CpuId 0"
               FriendlyName="CpuId 0">
            <Start>
              <Event Provider="{A4A76336-4BA7-4CD9-85C3-B9C236D3041C}" Id="103" Version="0" />
              <PayloadIdentifier FieldName="CpuID" FieldValue="0" />
            </Start>
            <Stop>
              <Event Provider="{A4A76336-4BA7-4CD9-85C3-B9C236D3041C}" Id="104" Version="0" />
              <PayloadIdentifier FieldName="CpuID" FieldValue="0" />
            </Stop>
            <Match>
              <Event TID="true">
                <Payload FieldName="Seq" />
              </Event>
              <SelfNest TID="true">
                <Payload FieldName="Seq" />
              </SelfNest>
            </Match>
            <Naming>
              <PayloadBased NameField="Tag" />
            </Naming>
          </Region>
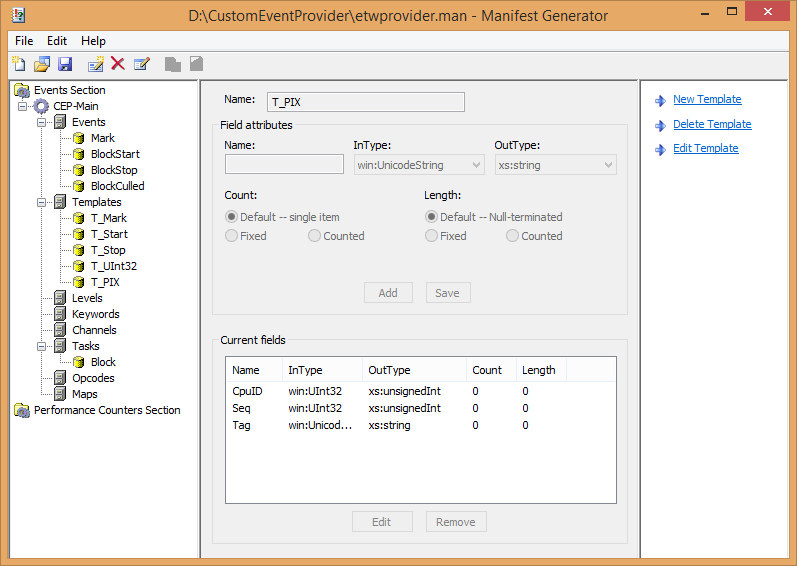
For a PIX-like view you need to have a separate region for each CPU, so the region definition file defines six regions named “CpuId 0” through “CpuId 5” (note that each region has a separate GUID). Our Start and Stop events (defined in the original manifest) use the T_PIX template that has fields for the CPU core number (CpuID), a sequence number to allow start and stop events to be matched (Seq), and a text tag for naming the region (Tag).
Figure 13. The template definition used to provide PIX bracketing in an ETL file
The start event for the CpuId 0 region is defined as follows.
  <Start>
    <Event Provider="{A4A76336-4BA7-4CD9-85C3-B9C236D3041C}" Id="103" Version="0" />
    <PayloadIdentifier FieldName="CpuID" FieldValue="0" />
  </Start>
This matches the BlockStart event in the manifest, but with an additional constraint that the CpuID field of the event must be 0. The start event for the CpuId 1 region is similar, but with a CpuID constraint of 1.
  <Start>
    <Event Provider="{A4A76336-4BA7-4CD9-85C3-B9C236D3041C}" Id="103" Version="0" />
    <PayloadIdentifier FieldName="CpuID" FieldValue="1" />
  </Start>
This structure is repeated for the other four cores. In a similar way, the stop events for the regions are defined based on events with an Id of 104 (BlockStop).
The region definition CpuId 0 is defined to only match events whose CpuID field is 0. Similarly events for the CpuId 1 region must have CpuID 1 and so on. This high-level definition of the regions separates events from each core into their own timeline.
Now that the events have been separated by core, you need to ensure that start and stop events are matched together correctly. If there was no possibility of start/stop pairs overlapping (no nested events) then the WPA built-in heuristics would display the regions correctly. As it is, you need to use the event’s sequence number (Seq) to match event pairs. The EtwScopedEvent class ensures that the same sequence number is used for the start event at the beginning of a block of code, and the stop event at the end of it. You can use the Match node in the region definition file to constrain event pairs to have the same sequence number.
  <Match>
    <Event TID="true">
      <Payload FieldName="Seq" />
    </Event>
    <SelfNest TID="true">
      <Payload FieldName="Seq" />
    </SelfNest>
  </Match>
The Event node indicates that matching events must have the same value of the Seq field, with the TID=”true” attribute enforcing the requirement that matching events must also have the same thread ID. The SelfNest node indicates that our event pairs can nest hierarchically, and (again) that start/stop pairs must have matching thread ID and Seq field.
Finally, the Naming node is used to name the region based on the value of the Tag field in the event.
  <Naming>
    <PayloadBased NameField="Tag" />
  </Naming>
Note that if execution migrates from one CPU core to another during the lifetime of an EtwScopedEvent then no ROI will be displayed for that event as there won’t be an event pair with matching CpuID and Seq.
Summary
Augmenting the existing system event providers with your own events that carry title-specific information can help you to better understand the interplay between title state and performance, particularly in scenarios where you are using the sampling profiler. Regions of Interest further enhance your profiling capabilities by providing a clear visual correlation between title activity and other performance data.