Xbox Live Connection Statistics
The following statistics from Xbox One consoles connecting to Xbox Live represent connectivity classification for NAT types. This information should be used to help guide decisions in title design.
The measurements were sampled during October, 2016, from the global console population.
Latency to Xbox Live servers
The following table shows the round trip latency to Xbox Live servers for the median and slowest-performing networks. Lower values indicate better performance.
| Worldwide | Asia | Europe | North America | |
|---|---|---|---|---|
| Median | 129 ms | 245 ms | 178 ms | 89 ms |
| Slowest 5% | 455 ms | 500 ms | 466 ms | 400 ms |
| Slowest 1% | 1342 ms | 1533 ms | 1342 ms | 1426 ms |
The following diagram shows the cumulative percentage of console networks that have a given round trip latency (or better) to Xbox LIVE servers.
Figure 1. Latency to Xbox Live servers
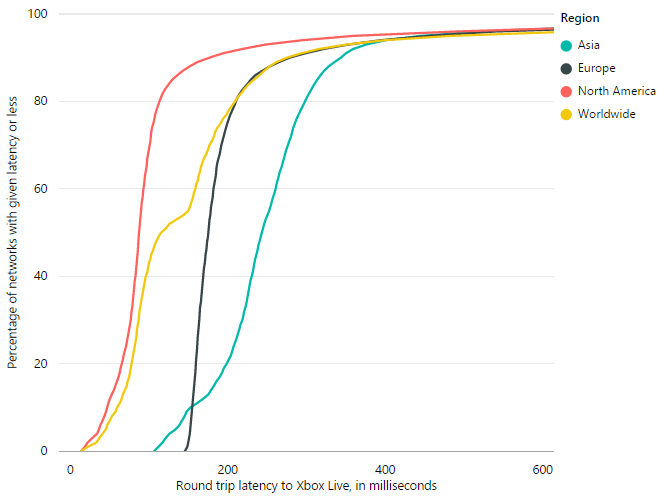
The horizontal axis represents the latency in milliseconds. The vertical axis represents the percentage of networks with a given latency.
Latency to peers
The following table shows the round trip latency between matchmaking peers for the median and slowest-performing networks. Lower values represent better performance.
| Worldwide | Asia | Europe | North America | |
|---|---|---|---|---|
| Median | 59 ms | 137 ms | 59 ms | 57 ms |
| Slowest 5% | 199 ms | 296 ms | 205 ms | 166 ms |
| Slowest 1% | 306 ms | 401 ms | 368 ms | 288 ms |
The following diagram shows the cumulative percentage of console networks that have a given round trip latency (or better) between matchmaking peers.
Figure 2. Latency to peers
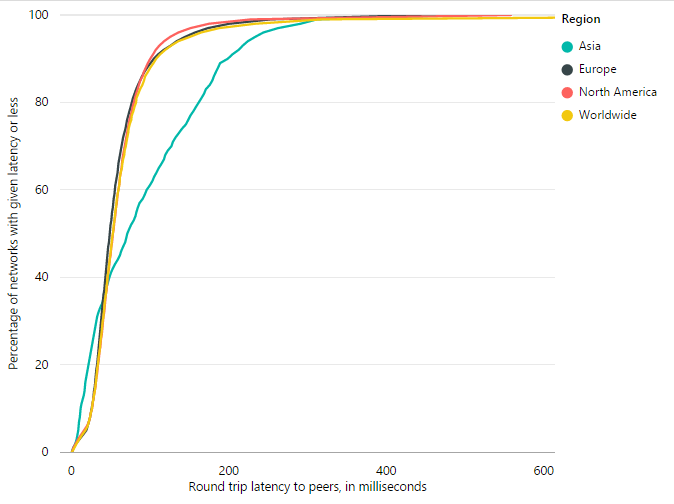
The horizontal axis represents the latency in milliseconds. The vertical axis represents the percentage of networks with a given latency.
Bandwith to Xbox Live
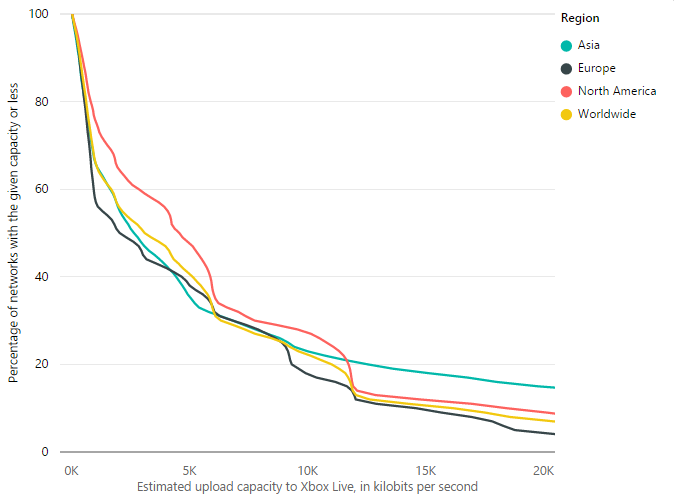
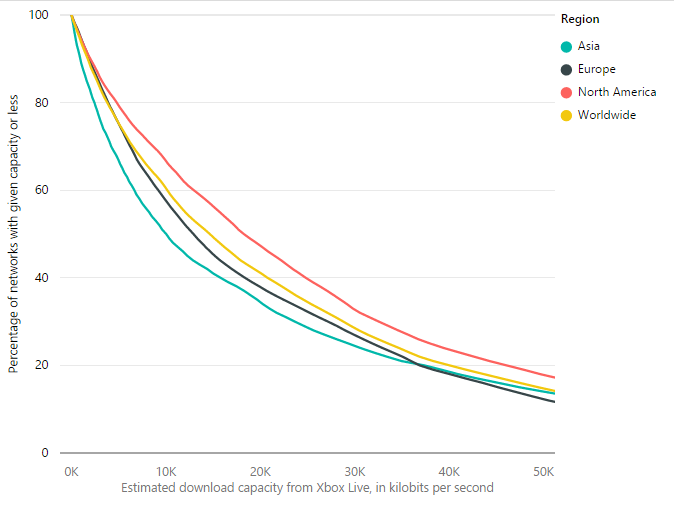
The following table shows the estimated network capacity upstream to or downstream from Xbox Live servers for the median and slowest-performing networks. Larger values represent higher performance.
| Worldwide | Asia | Europe | North America | |
|---|---|---|---|---|
| Median | 3026 Kbps up, 17988 Kbps down | 2586 Kbps up, 9855 Kbps down | 1969 Kbps up, 12755 Kbps down | 4530 Kbps up, 14304 Kbps down |
| Slowest 5% | 203 Kbps up, 872 Kbps down | 171 Kbps up, 396 Kbps down | 203 Kbps up, 896 Kbps down | 262 Kbps up, 718 Kbps down |
| Slowest 1% | 47 Kbps up, 85 Kbps down | 51 Kbps up, 63 Kbps down | 58 Kbps up, 125 Kbps down | 70 Kbps up, 85 Kbps down |
The following graph shows the cumulative percentage of console networks that have a given estimated network capacity upstream (or better) to Xbox Live servers. The horizontal axis represents the estimated upload capacity, and the vertical axis represents the percentage of networks with the given capacity.
Figure 3. Upstream bandwidth to Xbox Live
The following graph shows the cumulative percentage of console networks that have a given estimated network capacity downstream (or better) from Xbox Live servers. The horizontal axis represents the estimated download capacity, and the vertical axis represents the percentage of networks with the given capacity.
Figure 4. Downstream bandwidth to Xbox Live
Bandwidth to peers
The following table shows the estimated network capacity between matchmaking peers for the median and slowest-performing networks. Larger values represent higher performance.
| Worldwide | Asia | Europe | North America | |
|---|---|---|---|---|
| Median | 3365 Kbps up, 7229 Kbps down | 5528 Kbps up, 9177 Kbps down | 3576 Kbps up, 7396 Kbps down | 3283 Kbps up, 7149 Kbps down |
| Slowest 5% | 784 Kbps up, 3196 Kbps down | 914 Kbps up, 4199 Kbps down | 799 Kbps up, 3113 Kbps down | 806 Kbps up, 3303 Kbps down |
| Slowest 1% | 235 Kbps up, 1007 Kbps down | 438 Kbps up, 1640 Kbps down | 304 Kbps up, 1324 Kbps down | 330 Kbps up, 1777 Kbps down |
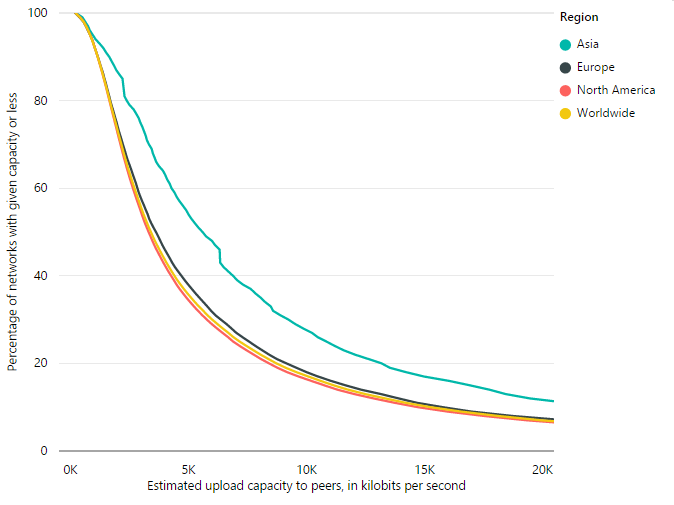
The following graph shows the cumulative percentage of console networks that have a given estimated network capacity upstream (or better) to matchmaking peers. The horizontal axis represents the estimated upload capacity, and the vertical axis represents the percentage of networks with the given capacity.
Figure 5. Upstream bandwidth to peers
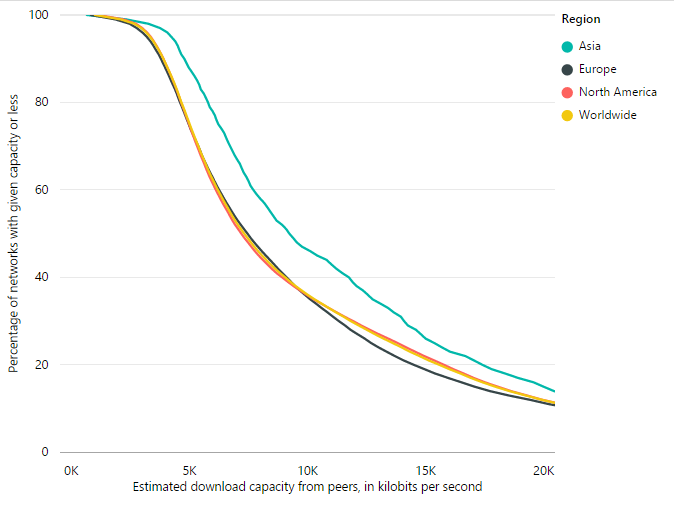
The following graph shows the cumulative percentage of console networks that have a given estimated network capacity downstream (or better) from matchmaking peers. The horizontal axis represents the estimated download capacity, and the vertical axis represents the percentage of networks with the given capacity.
Figure 6. Downstream bandwidth to peers
NAT types
| The following table shows the ratios of reported NAT types. | NAT Type | Worldwide | Asia | Europe | North America |
|---|---|---|---|---|---|
| Open | 69.71% | 62.59% | 76.67% | 67.16% | |
| Moderate | 23.97% | 25.50% | 17.35% | 26.73% | |
| Strict | 6.02% | 11.39% | 5.62% | 5.84% |