Optimizing for the Cloud
Published November 4, 2015
In this topic:
- Introduction
- Azure mechanics
- Profiling your code
- Optimizing your title
- Tools
- Recommendations
- Summary
Introduction
This paper uses Microsoft Azure for all of its examples and numbers. However, the patterns and suggestions discussed apply to other cloud providers that you may decide to use.
Running your server code on an Azure virtual machine (VM) can be a challenging task. The stock image is Windows Server 2012 R2. This is a fairly clean environment in that there are no unknown tasks running like you would see on an individual user’s machine. However, there are more tasks running than you would see in the Xbox One Games operating system. These tasks will also take more CPU time at unknown points in your execution.
This paper goes through some of the issues and the ways to resolve them to get the best performance when running on Azure. Most of these techniques will apply to other cloud providers as well.
Azure mechanics
Types of CPU cores
When running in a hypervisor, there is the concept of a physical core, a logical core, and a virtual core.
- The physical core is the actual core on the socketed CPU.
- A logical core refers to hyper-threading; for example, a CPU that has one physical core and is hyper-threaded would have two logical cores.
- A virtual core refers to the core that a virtual machine sees. The Hyper-V role maintains a mapping table from virtual cores to logical cores.
Instance types
There are a variety of instance types available. For specs on each instance type, see Sizes for virtual machines. You will have to make a decision on which type your game requires; the main consideration in which type of instance to run is cost versus power. The more powerful instance types tend to have a higher operating cost. If you find that your server is close to being able to run in a smaller instance type, the savings in operating costs versus the cost to optimize will very often pay for itself.
Virtual machine series
Virtual machines are available in two tiers: basic and standard. Both types offer a choice of sizes, but the basic tier doesn’t provide some capabilities available in the standard tier. The standard tier of sizes consists of different series: A, D, DS, G, and GS. The instance series defines how much CPU, memory, network bandwidth, and storage you are partitioned. The main difference between the A and D series is how the virtual machine is partitioned. In an A series, you get a time slice of the processor; other VMs will be using the same logical processer as your VM. In the D series, you will get 100% of the logical core; however, the logical core will be throttled down to match the stated performance metrics for the instance.
If you’re only hosting a packet repeater to avoid NAT tunneling issues, an A0 or A1 may be good enough for you. The main difference between A0 and A1 is that an A0 is effectively running at 50% of the power of an A1. However, if you are running a full simulation on your server, something like a D2 or D3 may be more suitable.
One thing to watch for is throttling/caps on network bandwidth. Check with your developer account manager (DAM) and the Azure team for specific details about what type of throttle you can expect. In the end, all numbers are a minimum that you will get. You may end up with higher performance numbers, but do not count on it.
Hardware generations
The Azure team keeps rolling out new generations of hardware that have increasing performance characteristics. At the same time, older hardware is being gradually phased out and no longer used. This happens behind the scenes and in general you do not have access or control over what generation your virtual machine executes on.
The instance type you select determines the amount of compute resources in a generation-independent way. The newer generation hardware is faster; however, this does not mean your title can execute more per frame. Hyper-V will throttle the virtual machine’s access to logical cores to maintain a consistent level of performance.
In general, the current systems are dual-socketed Intel Xeon processors with a total of 16-24 cores per socket. The underlying hypervisor will control the time the virtual machine is allowed to run to match its promised performance characteristics. However, the physical processor is shared between several virtual machines, so this means that the L2 and L3 caches are also shared between the virtual machines. As a result, other VMs have the potential of overwriting all of your data in these caches. You should take this into account when planning algorithms.
Hyper-V
Hyper-V is the hypervisor that Azure uses to execute each virtual machine. It is a role built into Windows Server 2012 R2 and is available on your desktop PC as Client Hyper-V, which you can use for local testing. You can find more information about the Hyper-V role in the TechNet Library.
There are several key considerations to take into account when running under Hyper-V.
Time slicing
Hyper-V works on a 10-millisecond (ms) timer per logical core. The generation of hardware your session is executing on determines how much of the 10-ms time slice your virtual machine gets per logical core. For example, you may get only 7 ms of the 10-ms time slice. This means you will run for 7 ms and then lose the next 3 ms. During these 3 ms, your logical core will get zero CPU time and will stall.
For various generations of hardware, the available percentage of the 10-ms time slice for your title can vary between 95% and 40%. The newer the generation of hardware, the less time your virtual machine will get on the hardware. However, the newer generation hardware is faster, so your title can execute the same amount of code per the 10-ms time slice. This number is subject to change in future generations, but overall throughput should be at the same or better.
One very important caveat to remember is that these time slices are subject to some drift. In one particular slice, a virtual core may get slightly less time to execute than normal. In the next time slice, it will get extra time to execute to make up for that.
Figure 1. Time slicing.

Slicing out of sync
If you are using an instance with more than one virtual core, there is no guarantee they will be running in sync. Because of this, if you want to measure your time slice when the stall happens, you need to measure for each virtual core.
Because the time slices are out of sync, great care must be taken for any cross-core communication. Sharing locking primitives across cores is very bad. It is also advisable to allow your threads to float between cores, so if a high priority thread is on a stalled core it can be moved to an active core.
Some locking primitives have the concept of changing ownership when they are acquired/released from separate threads. A prime example is a mutex object; in this case, the code that releases ownership of the mutex object will also grant it to a thread waiting on the mutex object. In some cases, a CRITICAL_SECTION operates the same way.
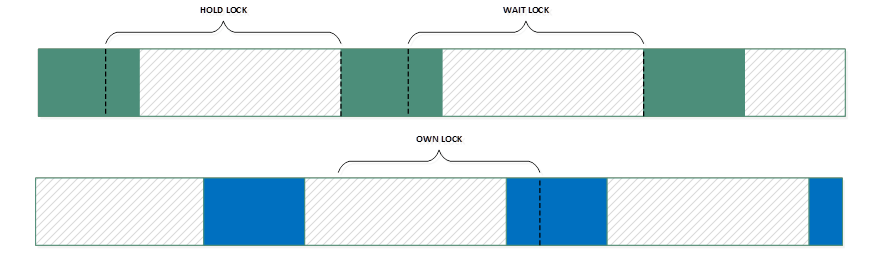
If threads are locked to cores that lose the time slice while waiting on a locking primitive that has the possibility to stall that thread and maybe the entire machine, see the case in Figure 2. There are two threads each locked to a different core, one to the green core and one to the blue core. The green thread holds the lock across a time slice and releases it when it starts running again. The blue thread immediately is given ownership of that lock; however, it’s not running. The blue thread won’t release ownership of the lock until it is running again. With time slicing, the green thread ends up waiting an extraordinary amount of time for the lock. In this case, what could have been a simple operation—less than a millisecond—ends up taking several milliseconds.
Figure 2. When threads are locked to cores that lose the time slice.
An even worse situation is the use of any kind of spin lock. A waiting thread could end up spinning across several time slices and even indefinitely (a worst case situation).
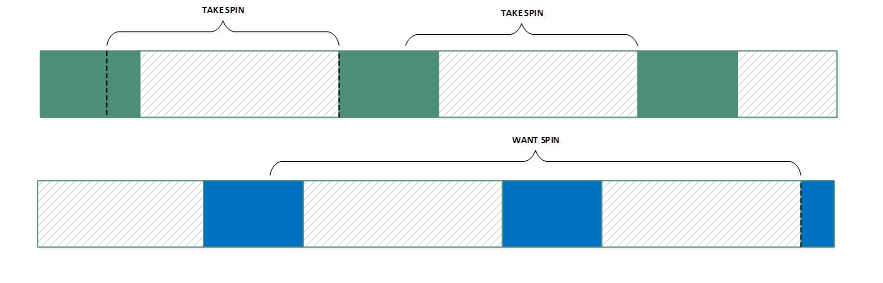
See the case in Figure 3. The green thread takes the spin lock and ends up holding it across the time it’s not running. The blue thread spins trying to take the lock, but fails to acquire the lock before it stops running. The green thread then starts running, but releases and reacquires the lock. When the blue thread starts running again, it has to continue to spin for its entire time slice because as far as it knows, the green thread never released the spin lock. In this case, the blue thread ends up waiting for almost two time slices or 20 milliseconds to acquire a simple spin lock.
Figure 3. Spin lock scenario.
One way to avoid the issues with the two previous cases is to allow threads to float between cores. In the first case, when the blue thread is given ownership of the lock, it will immediately be given a priority boost. If the green core ends up going idle, it will pull the blue thread over to it and start running on the green core. However, this only helps if a core manages to go idle; if there is even a low priority thread running, this will keep the blue thread from being pulled over.
Switching cores
If a time slice for a virtual core is less than 50%, it is possible for two virtual cores to be mapped to one logical core. In this case the virtual cores will always be out of sync and you will get the worst performance on any type of communication between them.
Hyper-V is allowed to share the physical core among several virtual machines or even your own machine. It is also allowed to remap virtual to logical cores between time slices; however, it will very rarely do this. Because of this, you should always assume the cache is cold at the start of each of your time slices. For maximum performance, you should attempt to get all of your work done within one time slice.
In Figure 4, a title is using two virtual cores, but each virtual core needs less than 50% of a logical core. Hyper-V has mapped both virtual cores onto one logical core. In this case, your virtual cores are running totally out of sync from each other.
Figure 4. Two virtual cores mapped onto one logical core.

Clock functions
The default clock functions within Windows work on a “wall clock” time. This means that the QueryPerformanceCounter function and the GetSystemTimeAsFileTime function will return the correct time and are unaffected by time slicing.
You can use this fact to determine when a time slice event has happened. To do this, sit in a tight high priority loop constantly checking QueryPerformanceCounter and wait for the clock to jump. This is the point in time where your virtual machine lost the core and just got it back. You can use the size of the jump compared to the 10-ms time slice to determine how much of the time slice you are getting.
Within Hyper-V, the QueryPerformanceFrequency function is locked to 10 megahertz (MHz). This means the resolution of QueryPerformanceCounter will always be 100 nanoseconds. Using the RDTSC instruction will give you the actual hardware TSC value, which will give significantly higher precision than QueryPerformanceCounter.
However, care must be taken when spinning like this; for details, see the Operating system starvation section later in this paper.
Profiling your code
Profiling can be a challenge when running on Azure. The underlying hardware generation may change. The iteration time between builds is large due to pushing new builds. The following are some tips to help with profiling your code.
Windows Server local copy
You should start your profiling on a local copy of Windows Server as opposed to Windows 10. The underlying scheduler is different. There is also a different set of background processes running. Make sure to install the same roles you plan to install on your Azure virtual machine.
Using your own local copy of Windows Server will drastically improve iteration times. You can install all of your development tools on it and perform code changes there as well. This has the potential to drop your iteration time between builds to several minutes, down from several hours.
Hyper-V instance
After determining that everything is working as expected, it is a good idea to switch to your own Hyper-V instance that matches the hardware specs of what you expect on Azure. Hyper-V is included in Windows 10. By using Hyper-V, you can adjust the computing power of the virtual machine and try different parameters.
Use the specs from Sizes for virtual machines to determine memory, hard drive size, and number of virtual cores. When configuring settings for the processor on the virtual machine, you can set the virtual machine limit (percentage). This determines how much of the time slice each virtual core is given on the logical core. The recommendation is to use intervals from 100% down to 20%. This way you can make sure your title is stable across multiple generations. Using 20% will cause the most problems and is a good starting point for testing.
Miscellaneous
You can query the physical CPU name/id by using the CPUID instruction within your virtual machine. This will give you the actual socketed CPU that your server is running on. You should also measure the time slice interval. Include these numbers with your in-game telemetry for later correlation with performance issues.
It is a good idea to include profiling tools such as XPerf as part of your install package. These are not part of the default virtual machine image. This saves you having to copy them over Remote Desktop later. You have just one package that needs to be installed for each iteration attempt.
Make sure to test against all known generations of hardware. When you are ready to actually test on Azure itself, work with your DAM to assist in getting one-off configurations to use for your testing.
Optimizing your title
Operating system starvation
The operating system requires a certain amount of time to run, which is the same issue you would run into in a desktop environment. The best description though is that your virtual machine sits between a console and a desktop in characteristics. The console has a known and fixed operating system overhead; the desktop is variable by user. On your virtual machine, you have a good idea of the services running, but less control over when it runs as opposed to a console.
On a single CPU virtual machine, plan on allocating ~50% to the operating system. This will keep it from eventually getting boosted above your process because it doesn’t have enough time to run. You can have occasional spikes in its usage but not consistently above the 50% number. On multiple core machines it can be less; just keep in mind 50% of one core is a good metric of time to reserve for it.
Previously in this paper we suggested that you sit in a tight high priority spin loop checking for the start of time slices. You should only do this at startup or once every couple of seconds. Doing this constantly on all of the virtual cores of your instance will definitely starve the operating system.
If the operating system feels that it’s being starved, you could see a spike in its usage in the 30-second range as it attempts to catch up with needed work. Your entire server will stall during this spike.
Steady frame rate
Achieving a consistently steady frame rate above 100 frames per second (fps) can be problematic. In fact, because of the 10-ms time slice, it is impossible to achieve this. You need to design your engine so that it can afford to lose several milliseconds of time.
The best way to achieve a consistently steady frame rate is to tie the start of your frame to the start of a time slice. Using the numbers that you generated from the QueryPerformanceCounter loop, you can calculate in advance when your time slice will start again. However, keep in mind that you need to keep track of this number for each virtual core. A better idea is using waitable timers.
Waitable timer objects
The Sleep function is really a suggestion to the operating system for how long to wait, and there can be a large amount of variance. You shouldn’t use it to try and get a consistent frame rate, especially with low values. Sleep is based on the current quantum time used by the kernel. For example, a Sleep(1) call could see up to 2 ms of latency if the quantum time is set to 1 ms.
Waitable timer objects should be used for the best measure of accuracy; they are based on the internal kernel clock. One suggestion is to set a waitable timer at the start of your frame based on your desired frame rate. If you know you can finish a frame within one time slice, it might be better to set your waitable timer to line up with the start of your time slice. However, if you do this, make sure to add some protection in case one frame happens to go long.
Make sure to call the timeBeginPeriod (1) function once at the start of your process. This will adjust the quantum of the scheduler to 1 ms. This is normally done on the Xbox One console through the audio system; because the server has no audio system, you need to do it yourself.
For more information, see Using Waitable Timer Objects on MSDN.
Spin locks
Most games like to use spin locks and/or a CRITICAL_SECTION with a spin count. If you are running on a single virtual core, you never want to do this. The issue is that if you end up having to spin, you will always spin for the full amount. The holder of the lock isn’t running, so it can’t release the lock. A spin lock without some kind of SwitchToThread call will always spin for the rest of its quanta. If you’ve set the quantum to 1 ms through timeBeginPeriod(1), the average wait will be 0.5-ms per spin.
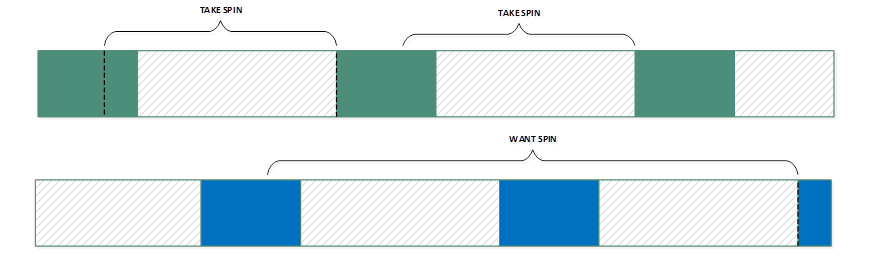
An even worse situation is that while you are spinning, the virtual core could lose its time slice. Another virtual core could end up coming in and acquiring the lock. In Figure 5, you can see that the green core ends up holding the spin lock across a time where it has lost the logical core. The blue core starts to spin waiting on the lock, but ends up losing its logical core. When the green core starts running again, it releases and then reacquires the lock before losing the logical core. The blue core has to wait again for an entire time slice before it can finally acquire the lock.
Figure 5. A virtual core losing its time slice.
Wait-free algorithms
A lot of titles like to use lock-free algorithms. However, lock-free algorithms are allowed to have spin locks. Lock free really means using no operating system primitives that can suspend the thread and potentially deadlock the entire system. As long as the system as a whole can continue making progress, the algorithm is lock-free. Individual threads are allowed to stall. You can have a spin lock, especially if it’s around a piece of code that takes less time to execute than one spin of a CRITICAL_SECTION. This is the issue mentioned in Spin locks where you can end up deadlocked for a considerable length of time on a thread.
The resolution is to attempt to remove all communication needs between threads and use wait-free algorithms wherever possible. In a wait-free algorithm, every thread is required to be able to make progress without any form of blocking. For more details, see Non-blocking algorithm on Wikipedia.
Work stealing
The ideal pattern to use when working in Azure is work stealing. In work stealing, multiple threads each have their own job queue. They first attempt to grab a job off of their queue and if none are available, they steal a job from another thread. This has the benefit of automatically balancing work load evenly in a time-sliced environment. If one thread ends up stalled or taking too long to complete a job, eventually other threads will take work from it as they free up resources. Because each thread has its own job queue, there is very little contention between all threads using the same job queue. For more details, see Work stealing on Wikipedia.
A step beyond that is the ability to support a thread that is actively taking work from the job that another thread is currently executing. An example would be a virtual core that has lost its time slice and stalled; the active work can be picked up by a virtual core that still has its time slice. However, care must be taken when doing this to avoid adding possible contention between the two threads when the work is stolen or being worked on by two different threads at the same time.
Tools
Local server instance
The most useful tool is to create your own local server instance. This should be done by using Windows Server installed on a physical machine. After the major issues are resolved, move over to a virtual machine instance running inside Hyper-V on a local machine.
When running your own local server, you can deploy your full development suite. This will allow for the best iteration time as changes can be tested immediately. Switching to your own Hyper-V virtual machine will still give you a rapid iteration time and more closely match the performance characteristics of Azure. You can easily have the virtual machine pull builds directly off a shared network location.
To set up your own Hyper-V instance, see the Hyper-V instance section earlier in this paper.
It’s preferable to have one physical machine that is only running Hyper-V. You can use either Windows Server 2012 R2 with the Hyper-V role or Microsoft Hyper-V Server 2012 R2. This lets you create multiple virtual machines to simulate a full load on an Azure server blade. Make sure to map out having more virtual cores than logical cores, as long as the total percentage adds up to 100% of the logical cores.
If you are running on another cloud provider, check with them on the specifications for their hypervisor and see if you can set up a local machine that matches.
Telemetry
Telemetry is vital for keeping a constant watch on what’s happening on your server over time. You should add the physical CPU type and the measured time slice to all of your collected telemetry data for each server instance. This will allow you to correlate problem areas to determine if an issue might be related to a change in hardware generation or to code adjusting for the time slice and not handling slight drifts over time.
You can use the CPUID instruction to determine the actual socketed physical CPU. By using this data along with the collected time slice data, you can set up a matching local server instance. This will help you reproduce the issue locally and determine a fix faster.
XPerf
XPerf and the Windows Performance Analyzer (WPA) are the standard tools for gathering performance metrics on Windows machines. They are standalone tools and can easily be added to your server package as part of your install, or copied over through a Remote Desktop session. You can download the latest version of the Windows Performance Toolkit as part of the Windows 10 SDK.
You can find a wealth of information about using these tools on MSDN, but following are some good starting points for command-line options:
xperf –on latency –stackwalk Profile+CSwitch- This will start the profile session with sampled and precise data.
-
Call stacks will be collected for all context switches and the sample points.
-SetProfInt [<n>]- Sets the sample rate.
-
Default is 10,000, which is 1 ms.
xperf –d <filename>.etl- Stops the current capture and saves the trace to
<filename>.etl
The Windows Performance Toolkit Technical Reference serves as a good reference about how to use XPerf and WPA to profile your title. You do not have to be running Windows 10 to use the provided tools.
When using WPA, you can very easily see when your virtual core is losing the logical core. Look at the CPU Usage (Sampled) Utilization by CPU window. There will be no samples from any process during the time you have lost the logical core. The sampling interrupt is not firing on the logical core.
Figure 6. CPU usage (sampled) utilization by CPU.
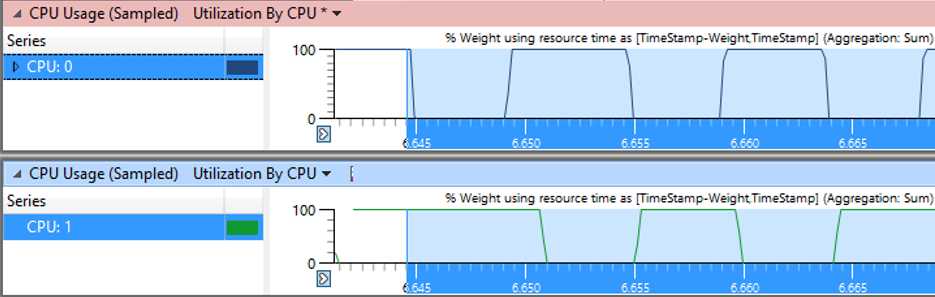
As you can see in Figure 6, it becomes very obvious where the time slices are happening and that they are not in sync with each other.
Using CPU Usage (Precise) Utilization by CPU will not give an accurate measure. Precise is based off of context switches and as far as the profiler is concerned, there were no context switches during this time. This means it will assume that the thread was running during the entire time it lost the logical core.
Recommendations
We recommend that you do the following to have the best possible experience:
- Start all testing on a local version of Windows Server along with a matching virtual machine in Hyper-V. This will give you the best iteration time and the most accurate measure of performance in the cloud.
- Avoid as much cross-virtual core communication as possible. This will avoid the possibility of stalls in your code.
- Test against a wide range of time slice values. This will help protect against multiple generations of hardware.
Summary
Running your server in the cloud has its own challenges compared to running on either desktops or consoles. We’ve provided a variety of information about how virtual machines work so that you can architect your server to minimize performance impacts. By keeping this information in mind, you can avoid last-minute issues that could seriously impact your launch.