PIX File IO Captures
1. Overview
The File IO profiler tracks all file accesses made by your title while the capture is running. The data provided by the profiler helps you understand your title’s file access patterns. The profiler also analyzes your access patterns and presents usage data that can help you tune the layout of your final package.
2. Capture Process
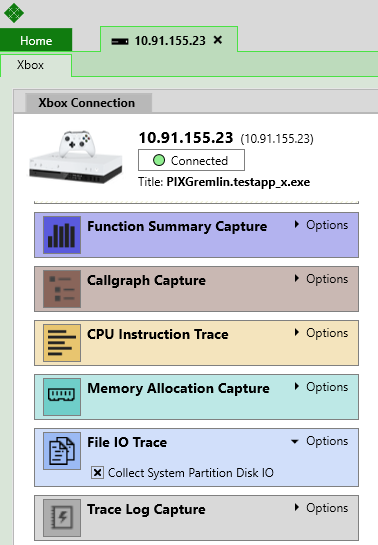
By default, File IO captures collect disk accesses made in the Exclusive Partition. If you’d like to collect data from the System Partition as well, check the “Collect System Partition Disk IO” box on the File IO Trace options pane. See Analyzing File IO Data from the System Partition for more information on how to view disk accesses that occurred in the System Partition.
To start a capture, click the File IO Trace button on your device connection tab.
When the capture starts running, you’ll see a dialog that lets you either stop or cancel the capture. File IO captures can run for relatively long periods of time. It’s common to use file io captures to profile a level load, or a play through of a significant part of your game, for example.
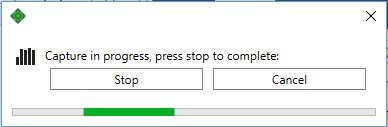
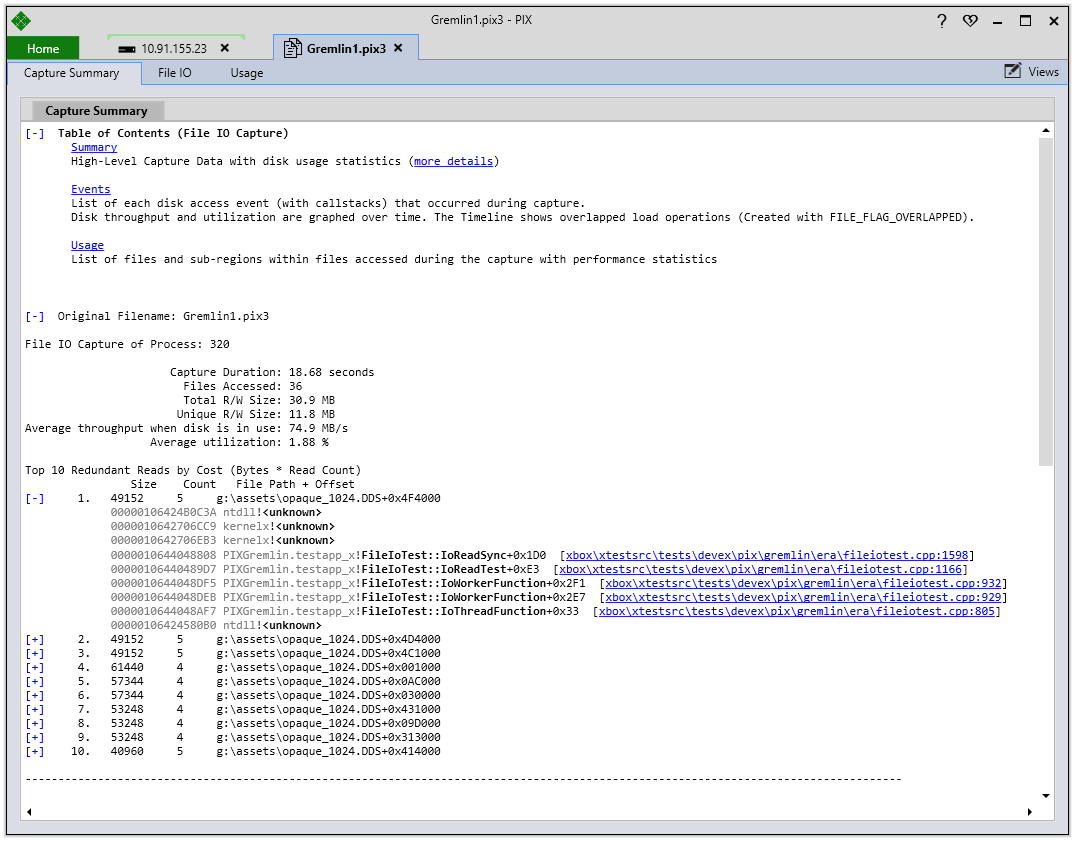
File IO captures are ETW-based. When you press the Stop button, the collection of ETW data will stop and PIX will open the capture. File IO captures open to a summary tab that provides some basic information about the capture.
3. The Summary Tab
The capture summary provides some basic statistics about the files that were accessed during the capture. These statistics include the number of files accessed, the amount of data that was accessed and the average throughput and disk utilization.
Full callstacks are also provided for the Top 10 redundant reads. The Top 10 list is ordered by a cost which is defined as the number of bytes read multiplied by the read count. Each entry in the callstack includes a hyperlink to the source file for that function (if PIX could find the PDB). Clicking on the hyperlink will open the source file in the default editor registered for the file extension. To open the source file in Visual Studio, right click on the hyperlink and choose “Open In VS”.
4. The File IO Tab
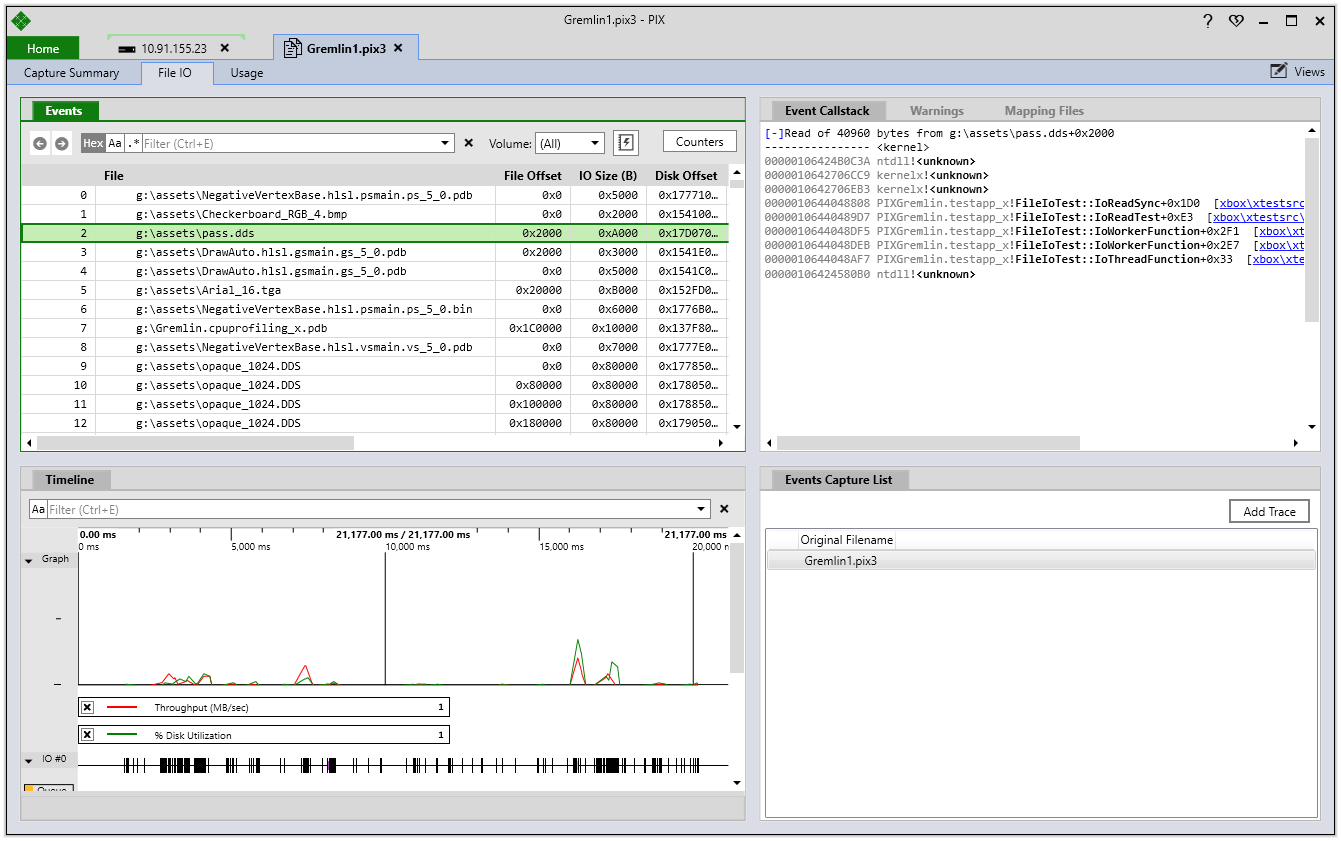
The timeline tab provides data on all file accesses made by your title as the capture ran. The event list view has one row for every file access, ordered by the time the access was initiated. By default, the events list includes columns that describe details such as the size, offset, start time and duration of the access. Click the Counters button to change the set of columns that are displayed.
The event list also contains a Notes column that the profiler uses to point out potential inefficiencies in your file access patterns. The most common non-blank value you’ll see in the Notes column is “Reverse Seek” indicating that the offset of the current access is less than the offset of the previous access. In other words, you’ve read backwards on the disk.
Selecting a row in the events list populates the Callstack view with the function name, source file and line number describing the location in your title that initiated the file access.
The bottom view in this tab is a timeline that shows the set of outstanding file IO operations at any point in time. The timeline includes a graph of IO throughput and disk utilization. The timeline and the events list are synchronized. If you select an IO event in the list, the corresponding section of the timeline will be highlighted, and vice versa.
The timeline uses colors to show stages of an IO operation. Orange bars indicate the time when an IO operation is queued and purple bars indicate the time in which an operation is actually being serviced.
4.1 Analyzing File IO Data from the System Partition
Collecting disk access data from the System Partition allows you to correlate disk activity in that partition with reads initiated by your title.
If you checked the “Collect System Partition Disk IO” checkbox on the File IO Trace options pane before starting the capture you can use Windows Performance Analyzer (WPA) to view the disk accesses that occurred in the System Partition while the capture was running. Clicking the Open in WPA button in the File IO tab will bring up a dialog that lets you choose whether to view disk access data from the System Partition or from the Exclusive Partition.
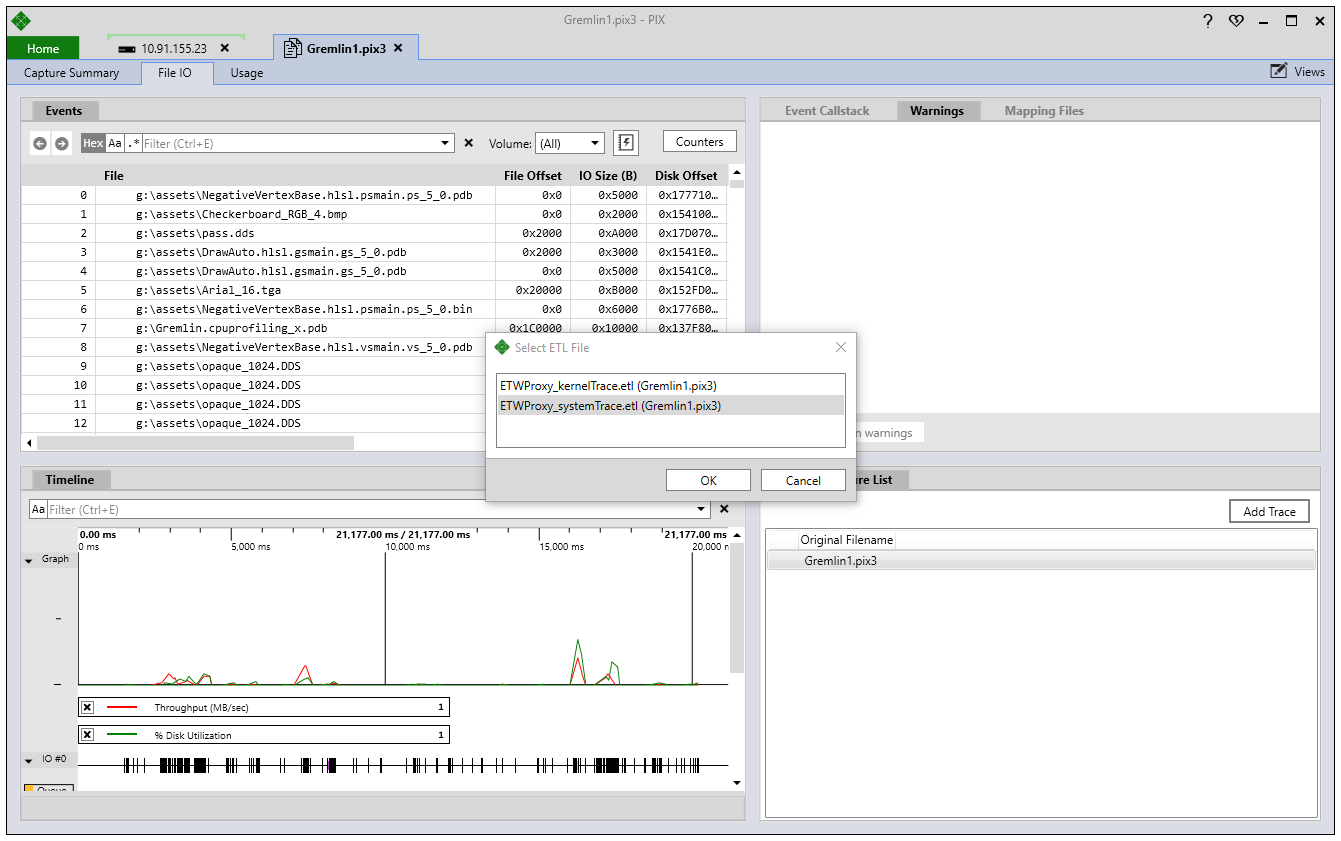
Selecting an etl file and clicking OK will launch WPA to analyze the disk activity in the partition you’ve requested.
5. The Usage Tab
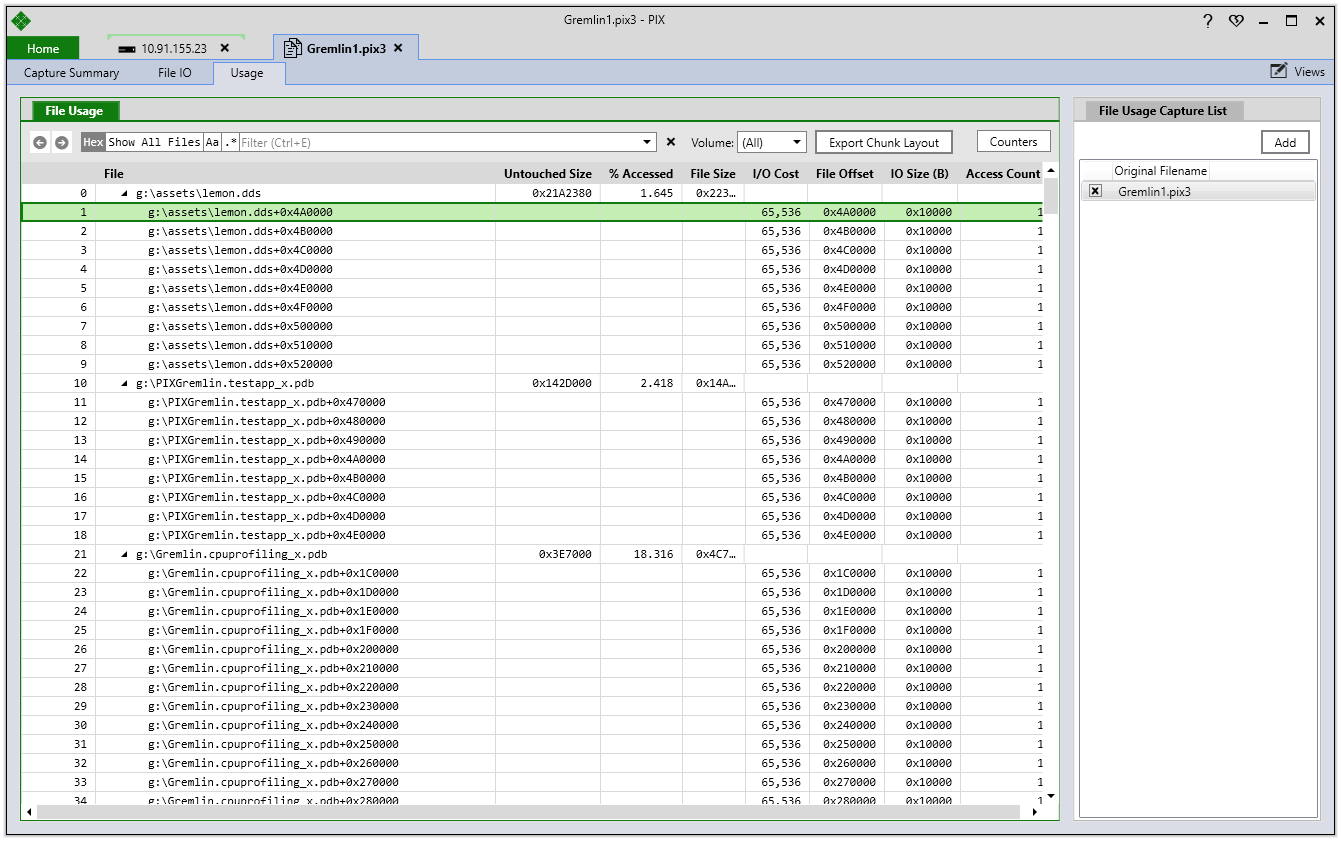
The Usage tab shows your accesses grouped by file. Presenting the data in this way makes it easy for you to see which files were read (and not read) during the capture. When compared with the files in a given section of your package layout, the data on the Usage tab can be used to adjust the files contained in that section. For example, you can use the file io profiler to determine which files you read during startup, then compare that set with the files contained in your launch section. If there are files contained in your launch section that don’t appear in the capture, consider removing those files from the section to minimize the amount of data that must be installed or downloaded before your title can begin running.
The Usage tab also shows data about the accesses within each file. This data includes:
- The percentage of each file that was read. This percentage is displayed in the % Accessed column. Large files for which only a small percentage is read are candidates for breaking into smaller files to reduce chunk size, if appropriate.
- The number of accesses for each offset within the file. This data can be seen using a combination of the File Offset and Access Count columns. A high access count indicates that you’re reading the same data from the file multiple times. More efficient file io performance can be obtained by optimizing your title to read data at a particular offset only once and caching the data in memory if possible.
6. Exporting Package Layout XML
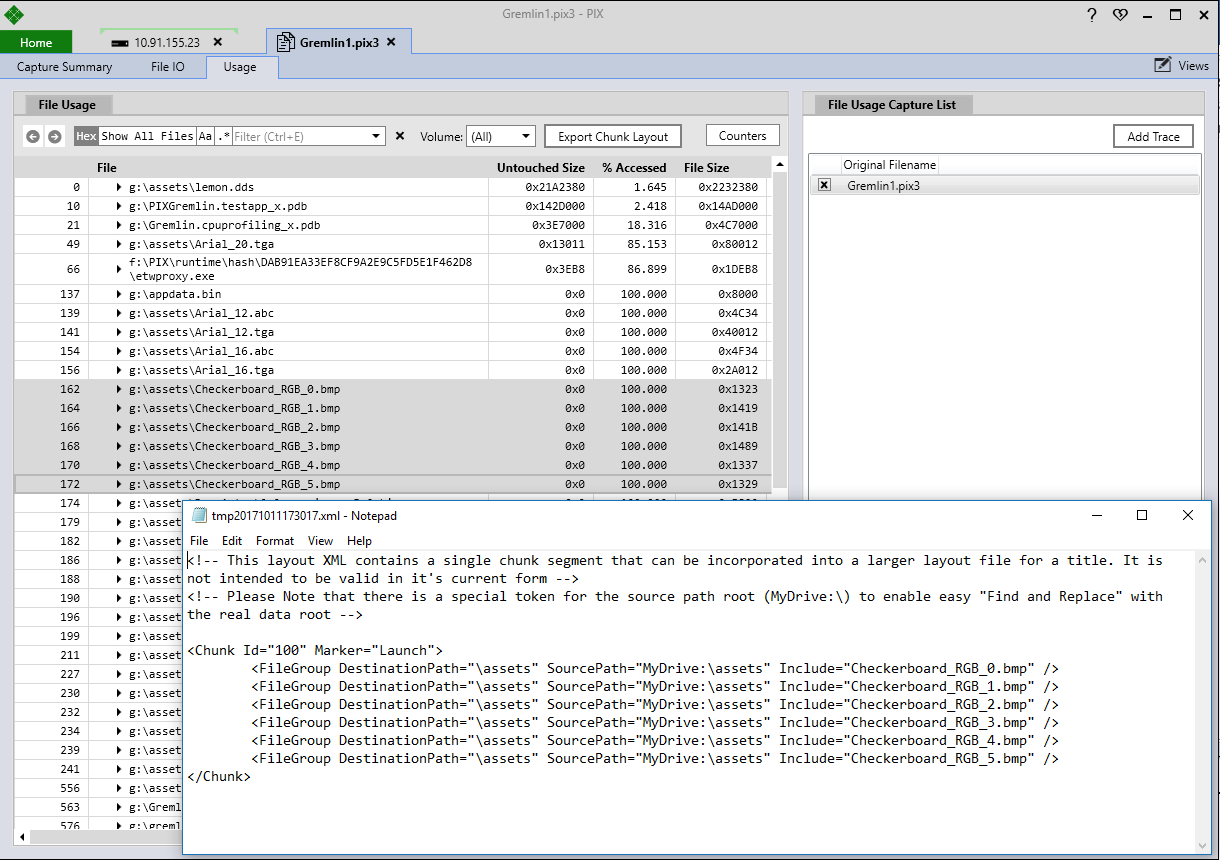
The analysis performed by the Usage tab helps you determine which asset files should be grouped into the various chunks that define your package layout. PIX can generate the XML that defines a chunk in your layout. To generate the XML, select the group of files you’d like in a chunk and click the Export Chunk Layout button. The XML will be opened in the application that is registered as the default handler for files with a .xml extension. You can then paste sections of the generated XML into the layout file used as input to the package build process.
7. Merging Multiple Captures for Analysis
The Usage tab makes it easy for you to see the percentage of each asset file that was accessed while the trace was running. This information can help you determine which asset files should belong in each chunk in your package layout. When doing this analysis, it’s often useful to view the data from multiple traces in a single analysis session. For example, if you have multiple testers playing through the same level of your game, it’s likely that different testers might cause different assets to be read. By combining the data from individual traces you can improve the accuracy of the analysis presented on the Usage tab.
To add an additional trace, select the Add Trace button and select the pix3 file you’d like to add using the file selection dialog:
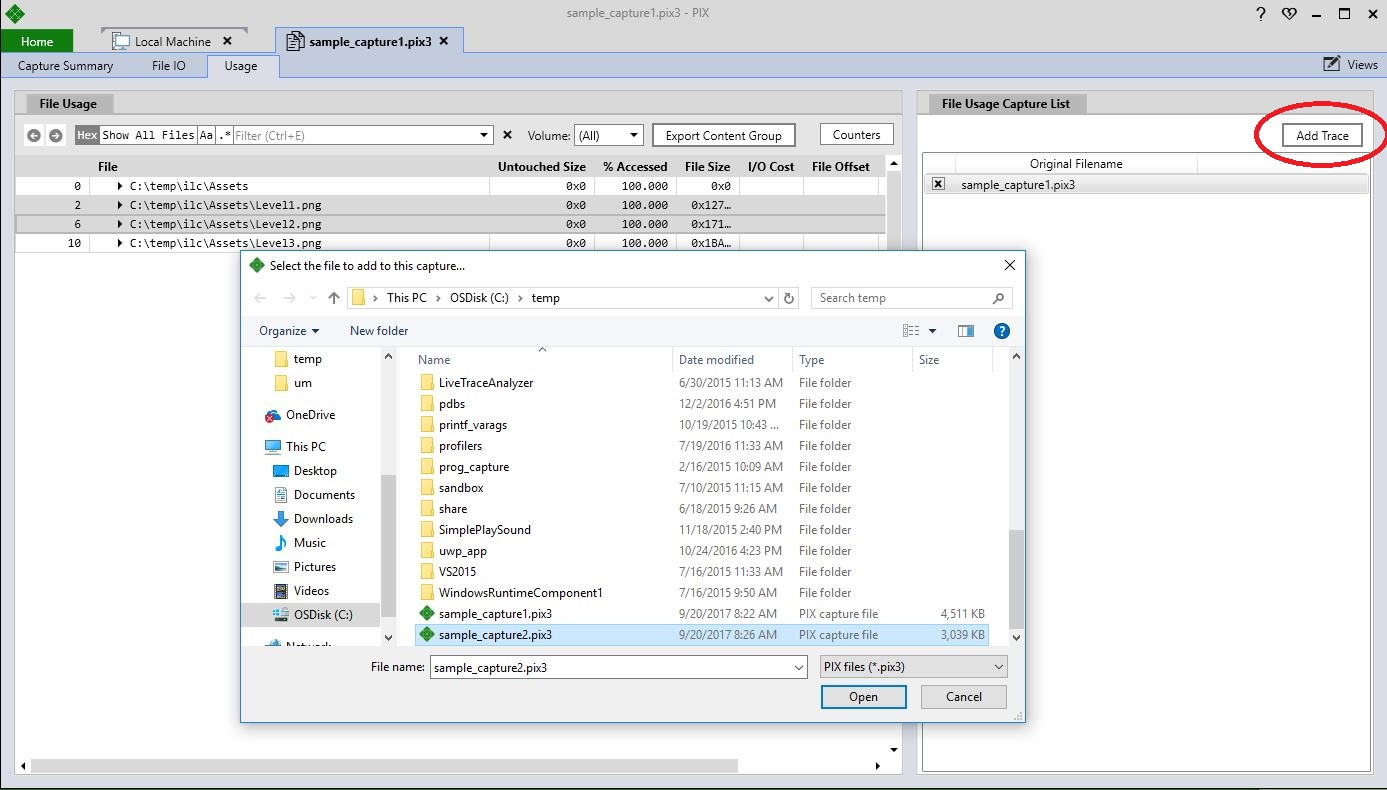
After you’ve selected a trace, PIX will create a new capture that contains the data from the original trace and the trace you just added. The contents of the two traces are merged and displayed in the File Usage event list. Any number of traces can be merged.
When merging data, PIX looks for asset files that have the same fully qualified files names. The reads of a given asset file from the multiple traces are analyzed and combined such that the unique data read in each capture is summed to produce a % Accessed value across all the captures. For example, consider the case where you have two captures that both read “c:\temp\ilc\Assets\Level1.zip”. If the first capture shows that 20% of that file was read and the second capture shows that a different 30% of that file was read, the merging of the two captures will show that 50% of the file was accessed. If the two captures include reads that are common to both, those reads will only be counted once in the merge. For example, if one capture reports that 20% of “c:\temp\ilc\Assets\Level1.zip” was read and another capture reports 30% was read, but 10% of those reads appear in both captures, the merged total would be 40% instead of 50%.
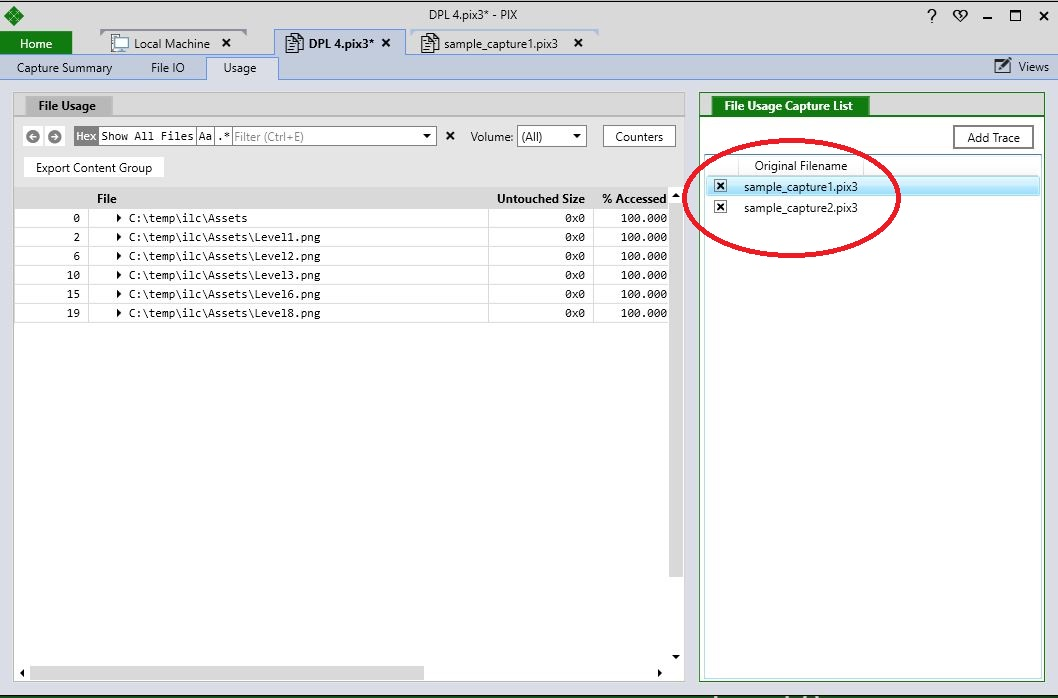
The File Usage Capture List view lists all the traces that have been merged into your capture. The checkboxes next to each trace can be used to toggle whether a given trace is merged into the data presented in the File Usage events list.
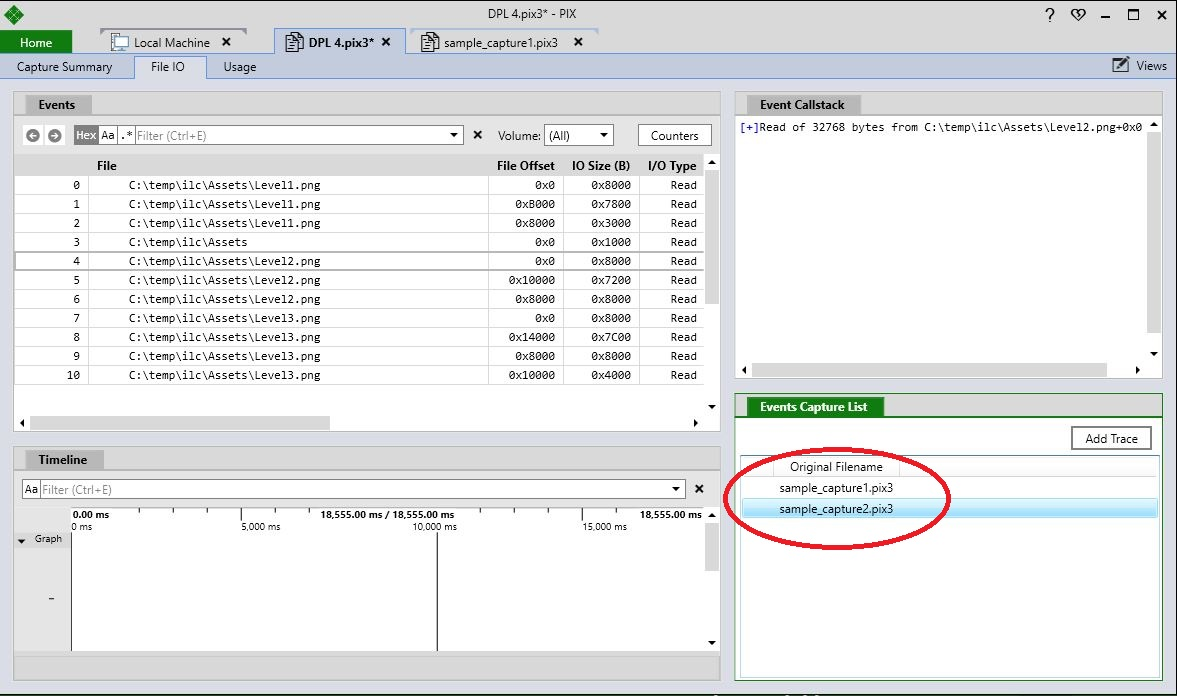
The File IO tab also includes a list of all captures that have been merged into the current capture. Selecting different captures from this list causes the contents of the Events, Timeline, and Event Callstack views to be populated with the data from the selected capture. No merging of data is performed on the File IO tab. The data on that tab is meant to show data on individual reads, so the merge concept does not apply.
8. Mapping Reads within Archive Files to Specific Assets
The File IO tab shows you information about every read initiated by your title as the capture was running. By default, PIX will show reads as seen by the underlying file system. If your title packages individual assets into a composite file such as zip or pak, the file io profiler will show that your composite file was read, but it needs more information to determine exactly which asset within the composite file was accessed.
PIX allows you to specify a mapping file that it uses to decode reads that occur within archive files, allowing you to identify the specific asset that was read. A mapping file consists of a list of entries, where each entry specifies the offset and size of a specific asset. A description for each asset must also be provided. PIX uses this offset+size information to map reads that occurred within the archive to the specific asset that was read.
8.1 Mapping File Format
Mapping files are in .csv format. This format should be easily producible either manually or from the portion of your build system that composes the archives.
The first line of the mapping file must be the fully qualified file name of the composite, or archive, file that the entries in the rest of the mapping file apply to.
Example first line:
g:\assets\Ice_King.DDS
The remaining lines in the mapping file identify the individual assets within the archive. Assets are identified by the byte offset within the archive file where the asset is stored, the size of the asset in bytes and a description of the asset. The format of an asset line is
<offset>,<size>,<description>
Example asset line:
28673, 256, sword
The offset and size values on an asset lines can also be specified as hex numbers, for example:
0x7001, 0x100, sword
Mapping files may also contain lines that are comments. PIX will ignore these lines when processing the mapping file. Comments lines start with a #.
Example comment line:
# this line is a comment. Ignored by PIX.
8.2 Working with Mapping Files
The Mapping Files view on the File IO tab is used to manage the mapping files associated with your capture. To add a mapping file, click the Add Mapping File dialog and select your .csv file from the file selection dialog.
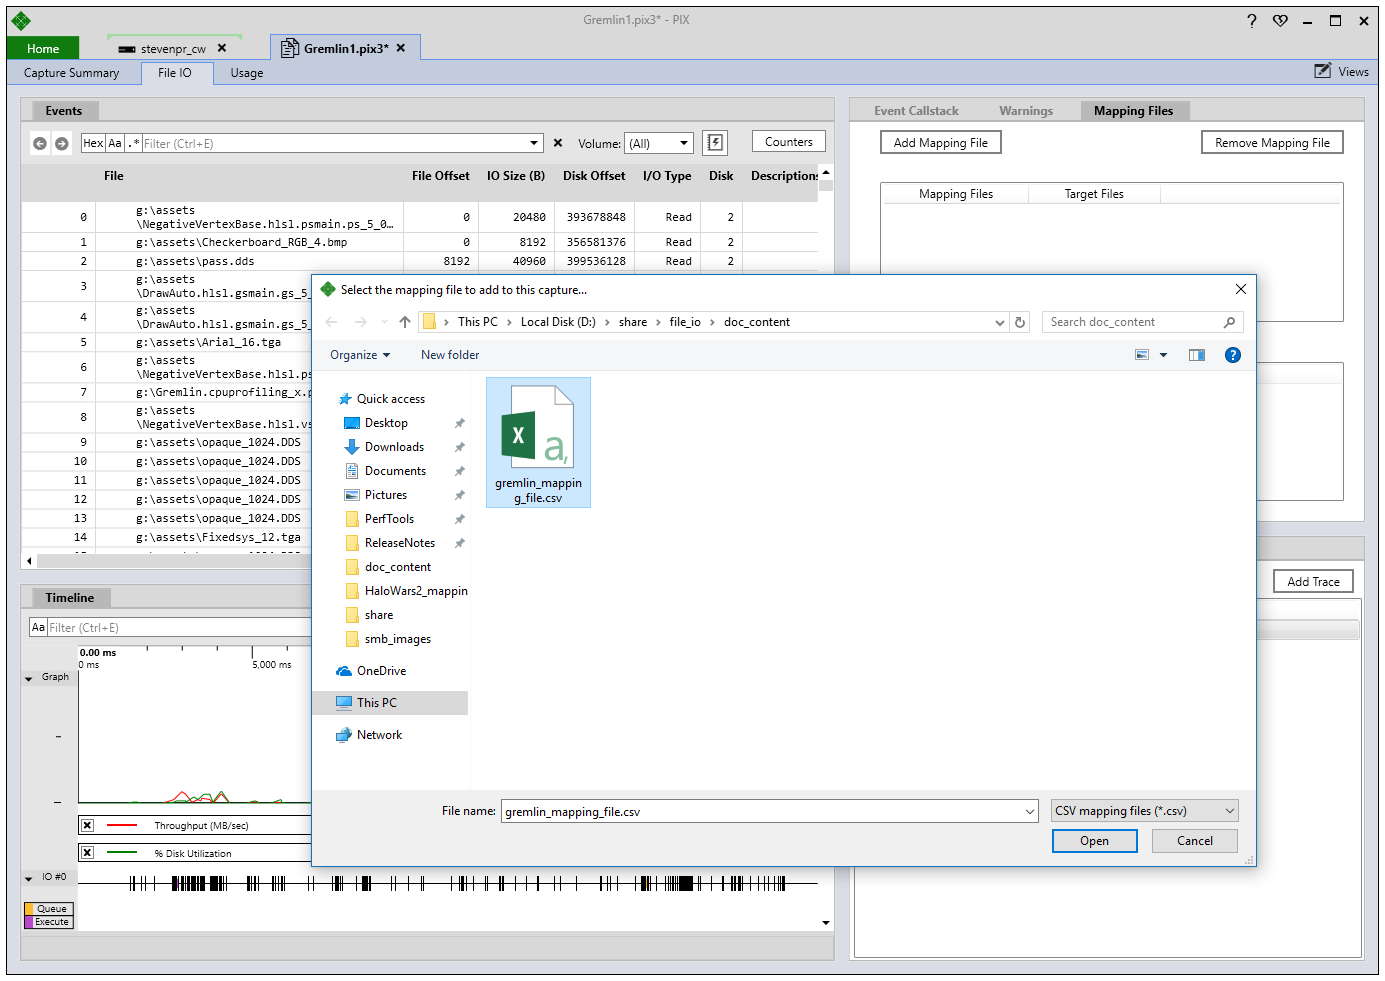
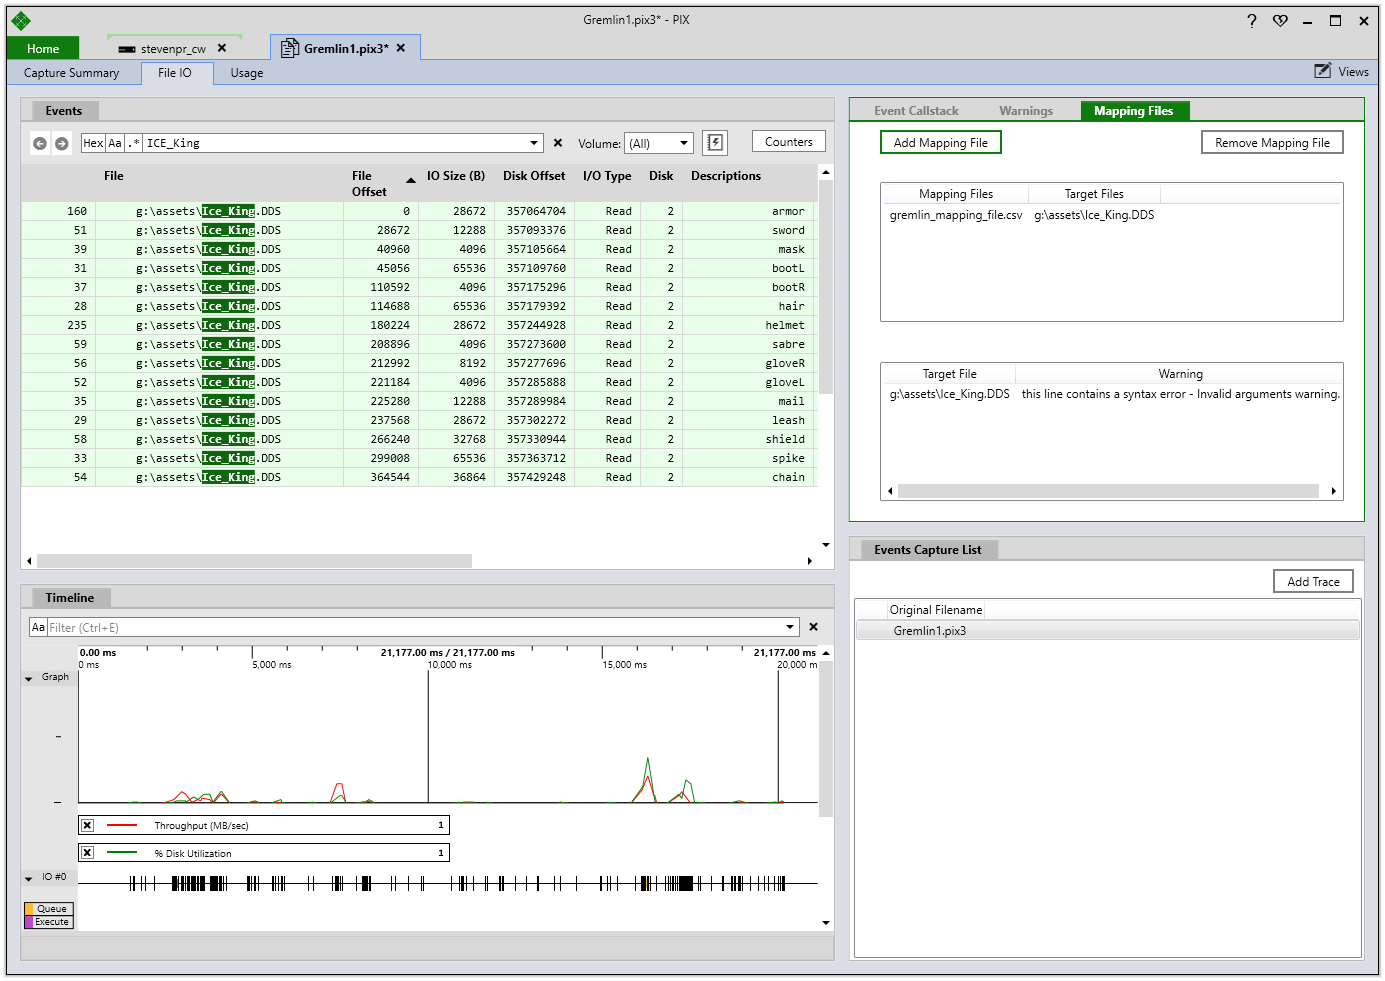
The mapping files you add are listed on the view along with the name of the archive file to which they apply. If your mapping files contains invalid lines, PIX will populate a second list that contains the name of the mapping file that contained the invalid line, along with the line’s contents.
After you’ve added a mapping file, PIX will update the contents of the Descriptions column in the event list based on contents of your mapping file. For example, adding a mapping file with the following contents:
g:\assets\Ice_King.DDS
0, 256, armor
28673, 256, sword
40961, 256, mask
45057, 256, bootL
110593, 256, bootR
114689, 256, hair
180225, 256, helmet
#this line is a comment
208897, 256, sabre
212993, 256, gloveR
221185, 256, gloveL
this line contains a syntax error
225281, 256, mail
237569, 256, leash
266241, 256, shield
299009, 256, spike
364545, 256, chain
Will produce the following result:
Mapping files can be removed from the capture by selecting a mapping file in the list and clicking the Remove Mapping File button.
Note that if you’ve merged multiple files io captures together using the Add Trace feature, any mapping files you add are associated only with the sub-capture that was selected in the Events Capture List at the time the mapping file was added. Mapping files don’t apply to all sub-captures automatically.