SmartGlass Log Viewer
The SmartGlass Hosted Companion SDK now includes the SmartGlass Log Viewer tool to make viewing log file content easier. The information that the SmartGlass platform writes to the log files on SmartGlass-enabled devices can provide valuable assistance for troubleshooting issues. Directly accessing these log files on SmartGlass-enabled devices, however, is not always easy. With the SmartGlass Log Viewer, you can view the log files in a centralized tool on your Windows-based desktop computer instead.
You run the SmartGlass Log Viewer tool on your Windows-based desktop computer. On SmartGlass-enabled devices, you can specify the IP address of the desktop computer on which you use the SmartGlass Log Viewer tool and want to view the log information. You can specify this address in SmartGlass Studio, or in your code if you create a SmartGlass app by using the Native SDK.
Additionally, if you already have existing log files that you obtained from SmartGlass-enabled devices, you can use the SmartGlass Log Viewer to conveniently examine those log files.
The SmartGlass Log Viewer on the desktop listens for remote devices that turn on the capability to send log information to the SmartGlass Log Viewer, and then listens for the log information. When you turn on the capability to send log information to the SmartGlass Log Viewer from the SmartGlass-enabled device, the SmartGlass-enabled device pushes log information to the desktop.
Note The SmartGlass-enabled device sends log information to the SmartGlass Log Viewer by using best case delivery, sending as much information as quickly as it can. With this method of delivery, some trace information may get dropped.
The SmartGlass Log Viewer tool allows you to perform the following tasks:
- Receive log information from multiple devices simultaneously.
- Filter the log information that the SmartGlass Log Viewer displays based on the following properties:
- The session that generates the log information.
- The trace level of the information, such as Error, Warning, Information, and so on.
- Read local log files or connect to remote logging sessions in real time.
- Generate a Unified Modeling Language (UML) sequence diagram from a selected set of log entries that shows when the app enters and exits methods.
Note To generate a UML sequence diagram, you must have Microsoft Visio 2013 installed on your computer.
Connecting to the SmartGlass Log Viewer
You can connect to the SmartGlass Log Viewer from either SmartGlass Studio or from an application that you develop with the Native SDK.
To connect to the SmartGlass Log Viewer from SmartGlass Studio
- On your desktop computer, start the SmartGlass Log Viewer.
- On the File menu, click Open Remote.
- On the Remote connection dialog box, note the IP address of your computer.
- On the SmartGlass-enabled device, from the Current Trace Level on the Log screen in SmartGlass Studio, click the trace level that represents the amount of trace information that you want the log to include. When you click a trace level, the log that SmartGlass Studio creates contains messages with that trace level or any trace level higher in the list. For example, if you click Warning, the log contains both warnings and errors. On released SmartGlass-enabled devices, the default trace level is Error.
- In the IP address box, type the IP address of the desktop computer from step 3.
- Click Enable remote viewer.
- Perform the tasks of interest in SmartGlass Studio, such as clicking Discover Consoles on the Connect screen. SmartGlass Studio does not establish the connection to the SmartGlass Log Viewer until you perform actions in SmartGlass Studio that generate log entries. Actions that generate log entries include discovering consoles, connecting to a console, and so on.
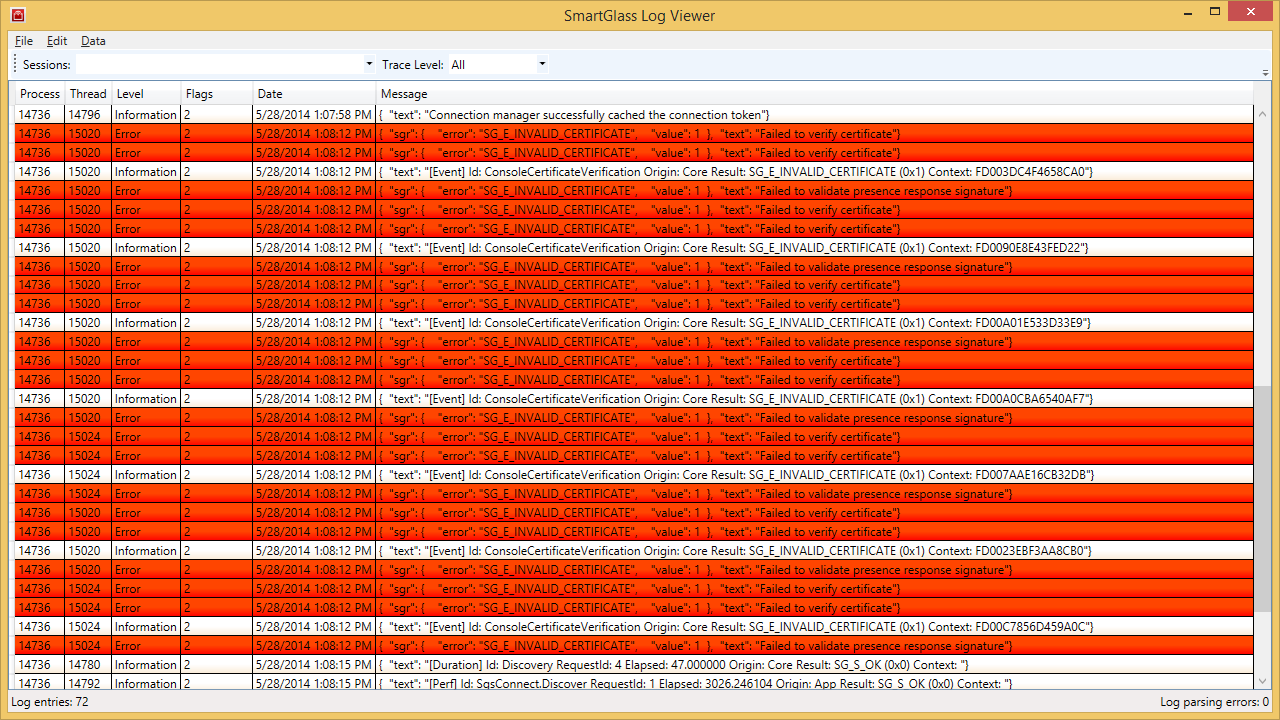
On the desktop computer, log messages that the tasks generate appear in the SmartGlass Log Viewer. The following screen shot shows an example of the information that the SmartGlass Log Viewer displays. In this example, the log messages were generated when Discover Consoles was clicked on the Connect screen. For some of the consoles that SmartGlass Studio discovered, errors occurred where the certificate for the console was not valid.
To connect to the SmartGlass Log Viewer from an app that you create with the Native SDK
- In the code for your app, set the value of the TraceLog::RemoteViewer (TraceLog.RemoteViewer in C#, XsgTraceLog.remoteViewer in Objective-C) property to the IP address of the desktop computer on which you use the SmartGlass Log Viewer tool and want to view the log information. (In Java, pass the IP address to the TraceLog.setRemoteViewer method.)
- Set the value of the TraceLog::RemoteViewerEnabled (TraceLog.RemoteViewerEnabled in C#, XsgTraceLog.remoteViewerEnabled in Objective-C) property to true (YES in Objective-C). (In Java, pass a value of true to the TraceLog.setRemoteViewerEnabled method.)
- On your desktop computer, start the SmartGlass Log Viewer.
- On the File menu, click Open Remote.
- On a SmartGlass-enabled device, run your app.
Opening a local SmartGlass log file
You can use the SmartGlass Log Viewer to view the traces in a SmartGlass log file located on your local desktop computer. You can open the log files that are associated with either SmartGlass Studio or with the Xbox One SmartGlass app without knowing the name of locations of those files. You can also open a log file if you know the name and location of the file.
To open a log file for SmartGlass Studio
- On the File menu, click Open SmartGlass Studio Desktop to open the log file for the version of SmartGlass Studio app for desktop computers. or
On the File menu, click Open SmartGlass Studio WinStore to open the log file for the version of SmartGlass Studio app for Microsoft Store.
To open a log file for the Xbox One SmartGlass app
- On the File menu, click Open SmartGlass App to open the log file for the Microsoft Store version of the Xbox One SmartGlass app. or
On the File menu, click Open SmartGlass Beta App to open the log file for the Microsoft Store version of the Xbox One SmartGlass Beta app.
To open a SmartGlass log file on your local computer
- On your desktop computer, start the SmartGlass Log Viewer.
- On the File menu, click Open.
- In the Open dialog box, go to the folder that contains the log file that you want to open, then click the file and click Open.
Displaying log traces for a single session or trace level
You can filter the trace information that the SmartGlass Log Viewer displays based on the session that produces the trace or on the trace level.
To display log information for a single session
- In the Sessions list, click the session for which you want to view log information.
To display log information with a particular trace level
- In the Trace Level list, click the trace level for which you want to view log information.
Generating a UML sequence chart
In SmartGlass Studio, you can include information in the log traces about when the app enters and exits methods by setting the trace level to method tracing. When you set the trace level to method tracing and turn on sending trace information to a remote computer, the method traces do not appear in SmartGlass Log Viewer while the device is sending traces to the SmartGlass Log Viewer, but SmartGlass Studio saves these method traces in the log file. You can open the log file locally in the SmartGlass Log Viewer later to view the method traces, and can generate a UML sequence chart from these method traces.
To generate a UML sequence chart from method traces in the SmartGlass Log Viewer
- On a SmartGlass-enabled device, on the Log screen in SmartGlass Studio, click Method Tracing in the Current trace level list.
- Perform a task of interest, such as clicking Discover Consoles on the Connect screen.
- Transfer the SmartGlass traces file to your desktop computer.
- In the SmartGlass Log Viewer, open the file as described in Opening a local SmartGlass log file.
- Select the set of method traces for which you want to generate a UML sequence diagram.
- On the Data menu, click Generate UML Sequence Chart.
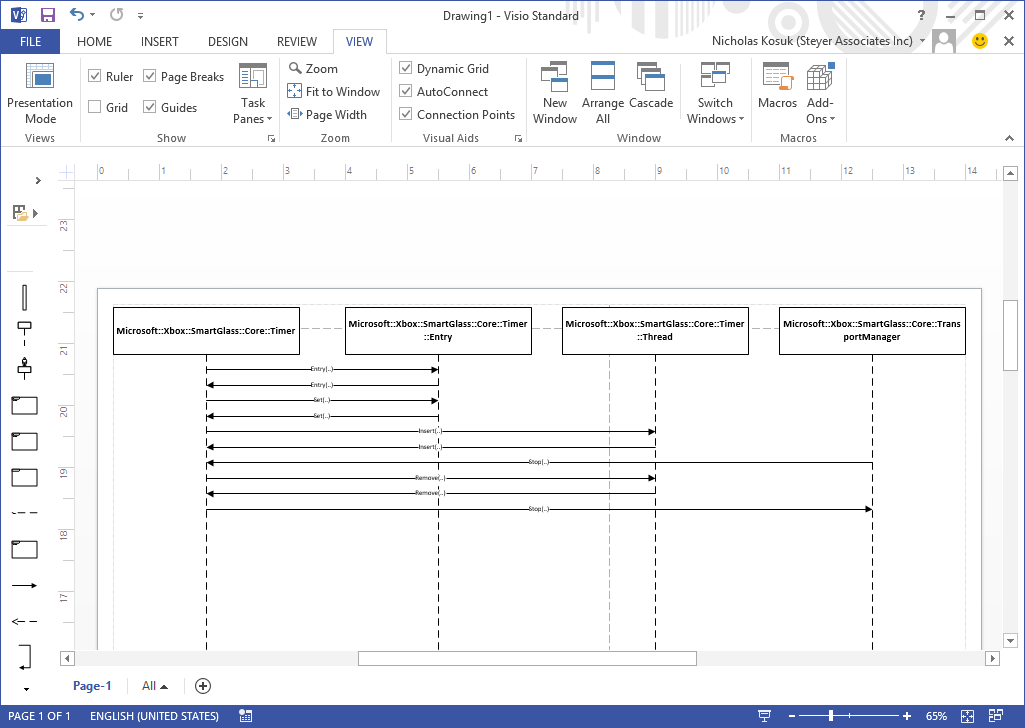
The following screen shot shows an example of a UML sequence diagram that the SmartGlass Log Viewer generates in Visio.
Determining the amount of time elapsed between traces
In the SmartGlass Log Viewer, you can easily determine the amount of time that elapsed between the first and last traces in a group of traces that you select from the display.
To determine the amount of time that elapsed between traces
- In the SmartGlass Log Viewer, select the group of traces that includes the traces of interest as the first and last traces of the group.
- On the Data menu, click Elapsed Time. At this point, a dialog box appears that displays the amount of time that elapsed for the selected log entries.