xbWatson
xbWatson is a lightweight tool that allows you to use your development PC to monitor system-wide debug output coming from an Xbox One console. The April 2018 XDK contains a big update for xbWatson, adding new features and improving on some old ones. xbWatson now has a rules editor which allows output customization and actions, process monitoring and control, and also allowing you to collect heap, triage and mini dumps.
Overview of Features
- xbWatson allows you to collect system-wide debug output from both the Exclusive and System partitions
- Use the rules editor to filter and customize output
- Separate output streams across multiple output tabs
- Save and distribute your customized rules and settings
- Get detailed Exclusive partition process monitoring and controls
- Create and manage triage, heap and mini crash dumps
xbWatson is session-based, meaning that it’s lifecycle is dependent on a connection to a specific console. You cannot disconnect an existing session and reconnect it to another console. You can, however, open multiple instances of xbWatson, each connected to a different console. xbWatson is collaborative - meaning there are no exclusive connections, or accidental locking of consoles. Multiple instances can target the same console and will work well together, even from different computers or developers.
Contents
Prerequisites
xbWatson has the following prerequisites:
- XDK Tools version: April 2018 or newer
- Console OS version:
- To view debug output coming from the Exclusive Partition, you console OS version must be from August 2016 or newer.
- To view debug output coming from the System Partition and to collect crash dumps, your console OS version must be from March 2017 or newer.
- Invasive debug attach requires your title to be built with the April 2018 XDK or newer.
Launching xbWatson
xbWatson can be launched either from an XDK command prompt or by searching for xbWatson from the Start menu. xbWatson will connect to your default console unless overridden by providing a test console IP or host name on the command line.
Launching xbWatson from command line, picking up the default console:
C:\Program Files (x86)\Microsoft Durango XDK\bin>xbwatson.exe
Launching xbWatson with IP or hostname override:
C:\Program Files (x86)\Microsoft Durango XDK\bin>xbwatson.exe consoleIP
On startup xbWatson will load a default configuration file named defaultconfig.txt located at %localappdata%\Microsoft\Xbox One Development Kit\xbWatson\2.0. This file saves the state of output tabs, their configuration, the rules, and applied rules. This file can be shared to other XDK users so they can quicly launch an xbWatson session with custom settings. You can load a shared config by
- Saving over the local defaultconfig.txt file
- From Windows, drag and drop a sharedconfig.txt file over xbWatson.exe
- Launch xbWatson.exe with a command line switch pointing at the saved config file
Main Output Window
The main output window consists of the Title Bar, Output Tabs, Rule Editor, and the Dashboard.
Figure 1. xbWatson
Title Bar
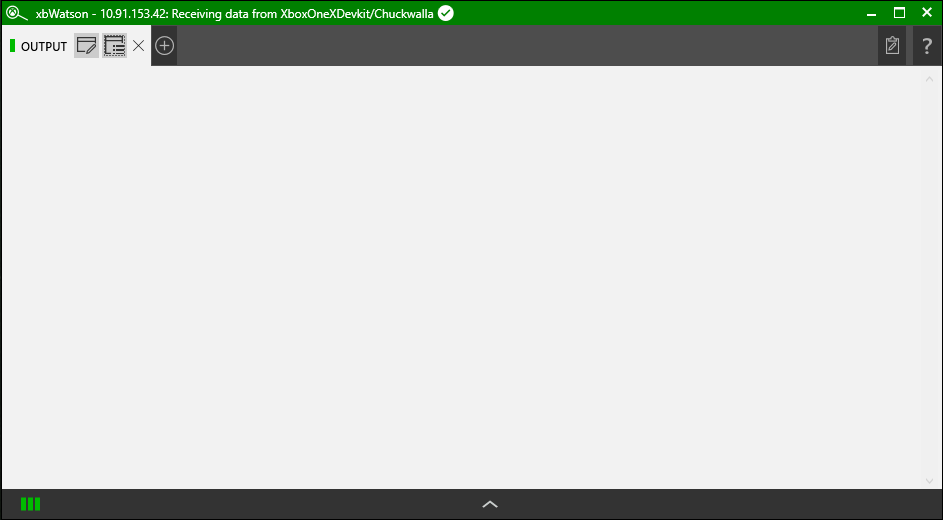
When xbWatson is connected to a console it will show you a green title bar with the connection details.
Figure 2. Title Bar (connected)

If xbWatson cannot connect, or dev kit services are not available you will see a red or yellow title bar. Check your IP address or ensure your dev kit is on a supported recovery to get connected.
Output Tab(s)
At startup you will see one default output tab. You can create more output tabs by clicking the plus sign to the right of the last tab, and you can remove an output tab by clicking the x sign on the right of that tab. You can rename the tab by clicking on the name (Output). When there is debug spew flowing from the console, the activity light for that tab will flash. Data can be copied from the output window by highlighting or selecting text and using standard Windows copy commands to move it to and from the clipboard buffer. Within each output tab you have the following option menus to configure that tab
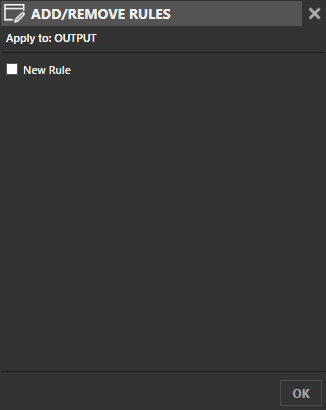
Apply Rules Menu
The apply rules menu will allow you to toggle on or off a rule for the current output tab. See the Rules Editor section below for more information about creating rules.
Figure 3. Apply Rules Menu
Data Feed Menu
The data feed menu allows you to configure the output streams that are shown by the current output tab.
Figure 4. Data Feed Menu
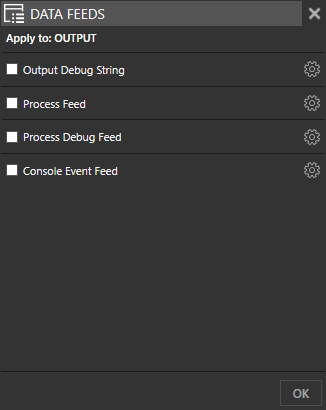
Output streams can be turned on or off by checking or unchecking their box next to the stream name. Individual options within that stream can be configured by clicking the gear icon to the right of the stream name.
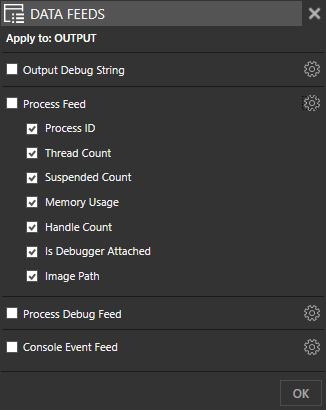
Available Data Feeds
| Data Feed | Description | Available in XDK |
|---|---|---|
| Output debug string | Debug output from both the recovery OS and the game OS | March 2017 |
| Process feed | Process change output from game OS | April 2018 |
| Process debug feed | Debug event output from a selected process. Available after Monitoring a process from the Game OS dashboard | April 2018 |
| Console event feed | Output from a curated list of Windows and telemetry events (currently focused on app registration and activation) | May 2018 |
Rule Editor
The rule editor can be found on the right side of the main output window.
Figure 5. Rule Editor
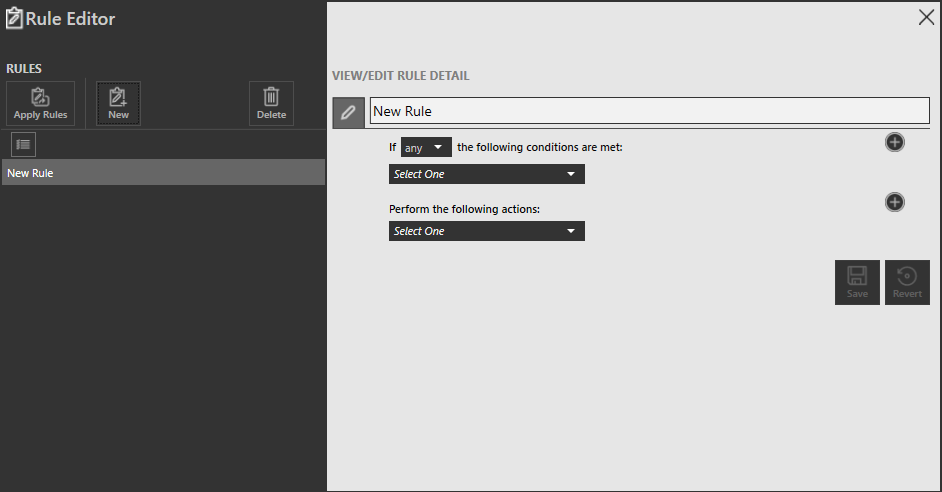
Steps to create a rule:
- Click “New” from the left pane. A new blank rule will be created
- Name the rule
- Add a new condition
- Match regular expression - enter a regex string to be evaluated
- Add an action (to be taken after successfully matching the condition)
- Change color - brings up a color picker to change the matched text
- Acquire stack dump - triggers the selected stack dump type
- Include text - displays only the text
- Exclude text - does not display the text
- Disable this rule - stops running this rule. Useful to allow you to grab a stack dump one time during an automated test run
- Set trigger to break - suspends the process and prepares for a debugger attach
- Invasively attach - attaches xbWatson as a debugger to the process
- Remove invasive attach - removes xbWatson as a debugger
- Flash window - flash the xbWatson icon in the taskbar
- Show banner message - shows a banner message at the top of the output window and turns the activity light for that tab red to catch the user’s attention
- Clear banner message - removes the banner message at the top of the output window
- Enable other rule - enables the specified rule for this output tab
- Disable other rule - disables the specific rule for this output tab
- Save the rule
Before the rule is active you must apply it to an output tab - you can do this by clicking “apply rules” from within the rule editor, or you can close the rule editor and apply the rule through the Apply Rules Menu directly on the output tab.
 Note Be aware of the “toggle multi-select” button when applying rules from the rule editor. Only the currently selected rules will be applied.
Dashboard
Figure 6. Dashboard

Clicking the up arrow at the bottom of the main output window will open the Dashboard. With the Dashboard minimized you will see dashboard status lights in the lower left hand corner of the window. These status lights correspond to the Dashboard items and will blink or change color to indicate data flow or a status change.
Log
The log contains information related to xbWatson itself, and xbWatson’s connection to the devkit. You can see what configuration file was loaded at startup, what IP address or saved connection string is being contacted, and other debug information about xbWatson here. This dashboard item will turn red if there is a problem connecting with the dev kit.
Game OS
When a title is not running on the dev kit, this dashboard item will display yellow and show that process data is unavailable. Without a title running you will see a minimum set of data about the dev kit settings.
When a title is running, you will see extended data similar to the Windows Task Manager. The color of the row indicates status
- Green - a change has occurred in the process data in the last 5 seconds
- Red - the process has ended
- Orange - the process is suspended, which includes debug (break)
- Blue - a debugger is attached, including xbWatson as an invasive attach
Selecting a row will allow the user to activate the options below the process list
Figure 7. Game OS Process List
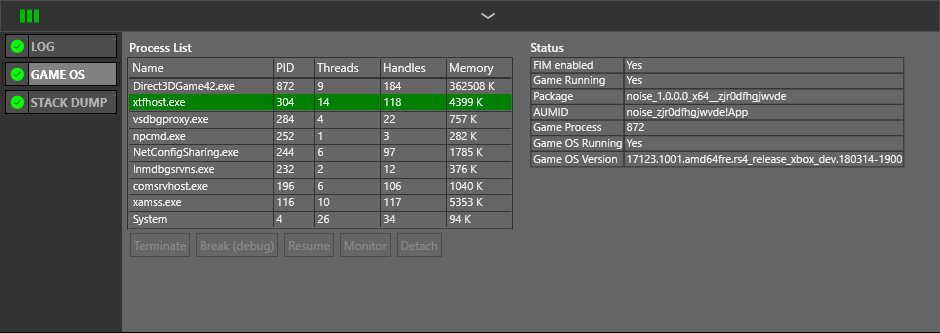
- Terminate Clicking on an active process and then clicking the Terminate button will kill the process
- Break (debug) This suspends the process and prepares for a debugger to attach
- Resume This removes the debug break and resumes the process
- Monitor Attaches xbWatson as an invasive debugger. Only one invasive debugger is allowed to attach to a process at a time, so connecting xbWatson in this manner will prevent Visual Studio from connecting to the process. Multiple xbWatson instances will share this attachment. Detach is automatic if all instances of xbWatson are closed. Once enabled the process debug data feed (available from the configure output stream UI) will begin to receive data. Output debug string will go through the process debug stream once attached.
- Detach Removes xbWatson as an invasive debugger
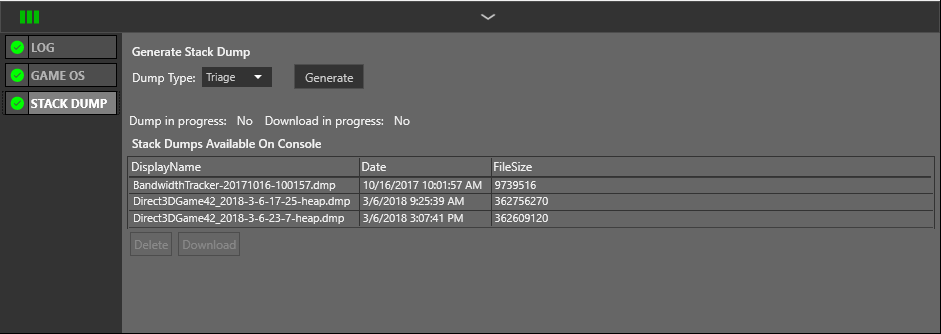
Stack Dumps
The stack dumps menu allows you to generate a Heap, Mini or Triage dump for the title that is currently running. This feature is only available for the Exclusive Partition. The generated dumps will be stored locally on the console and can be downloaded via the “download” button.
The “Generate” button will only be active if a title is running and if the version of the Exclusive Partition is capable of generating crash dumps in this way (from October 2016 or later). xbWatson will target the running game (process Id) in the Exclusive Partition that matches a game image name registered on the console.
Both the generate and download operations will cause the dashboard busy light to flash indicating activity.
Figure 8. Stack Dumps