Finding Cache and Branch Issues
Andrew Farrier, Advanced Technology Group
Updated September 18th, 2017
In this topic
What are the main data cache issues?
What are the main branch mispredict issues?
Performance Monitor Counters (PMCs)
Function Summary/Callgraph Capture
Introduction
This paper covers the high-level steps needed to find common cache-related issues and branch mispredict issues within an Xbox One title. Useful related documentation that’s available on the Game Developer Network (GDN) includes the following white papers:
- Xbox One CPU Introduction
- Xbox One Memory System
- Xbox One CPU: Branch Prediction
- No Problem—A Practical Look at PIX
It is vital that data cache and branch mispredict issues are located in title code so the costs can be mitigated.
The Xbox One CPU Introduction white paper lists the cost of a cache miss at >120 cycles versus the cost of a cache hit at 3 cycles. During these cycles the CPU core is not performing dependent work from those accesses. The speculative execution and Reorder Buffer can hide some latency, but not all, depending on cost.
The Xbox One CPU: Branch Prediction white paper lists the cost for a branch mispredict at a minimum of 14 cycles. This is due to the CPU core having to cancel all speculative execution and start filling the pipeline from scratch.
Depending on your title, each of these issues could be the difference between running at 30 frames per second versus running at 60 frames per second.
What are the main data cache issues?
- Data cache miss – The CPU core has requested data that is not available locally.
- The primary cause for a data cache miss is a poor layout of title data. The processor may attempt to prefetch data based on the title usage pattern.
- If the title does not read memory linearly, the processor will end up prefetching the wrong data and will stall as it waits for the correct data.
- Data contention – Two CPU cores are attempting to modify the same data simultaneously.
- Data that shares a cache line and is written to by different cores will cause a cache miss. The second core is required to request the data from the first core to continue. In almost all cases this cost is equivalent to reading from memory.
- This can happen with both globals that are shared between threads and with false sharing between data.
- Context switch – A CPU core is performing a high number of context switches.
- Each time a CPU core performs a context switch, a new thread starts running. The new thread has a high probability of accessing very different data from the previous thread. This results in a large number of cache misses.
- Related to this issue is a thread switching CPU cores. The new CPU core will not have any of the threads data in the cache. This will result in a high number of cache misses.
What are the main branch mispredict issues?
- Random branching – The worst possible case for branching is for a specific branch to randomly cycle between taken or not taken.
- The CPU will have poor data on how to predict the next branch, so there will be an inordinate number of mispredicts.
- Random target address – The target address for a branch changes based on data.
- It’s important to remember that a jump instruction is considered a branch. If the target address for the jump is a function pointer that changes, this has the same effect as a random branch.
Real sharing/false sharing
Each cache line is treated as a single 64-byte block of memory. Because of this, a title can have either real sharing or false sharing between data.
In real sharing, the plan is for the title to share a piece of data between cores. The shared data is known ahead of time and work can be done to mitigate the performance impact. The main way to mitigate the cost is careful control on when the data is accessed.
False sharing can be more insidious and harder to detect. Two different pieces of data sit next to each other in memory and thus will share a cache line. Because of this, any write to one will automatically invalidate the cache line for the other object. This is acceptable and beneficial when the code is executing on a single core. However, when code is executing on different CPU cores, you will get the data-contention issue mentioned previously.
You should very carefully map out what data is going to be shared between CPU cores and what data is not. For data that is shared between CPU cores, we highly recommend that each data item is unique per cache line to avoid any false sharing with other data.
Performance Monitor Counters (PMCs)
Each core on the Xbox One CPU has a set of built-in counters called Performance Monitor Counters (PMCs) that track a wide variety of statistics. The following four counters supply the information needed to locate cache and branch issues:
- Retired instructions – Each processor core can retire a maximum of two instructions per clock cycle. Retired instructions is the total that have retired since collection started.
- Data cache misses – The number of memory accesses that have missed the L1 cache and are required to be fulfilled by slower memory.
- Branch instructions – The number of branches the CPU processed.
- Mispredicted branch – The number of branches the CPU core mispredicted that required the speculative execution pipeline to be flushed.
The easiest place to see any PMC value is through PIX. PIX contains the ability to display a real-time graph of the current values in System Monitor along specific values in various captures.
System Monitor
The primary PMC to use for a holistic idea on how the title is doing is a composite PMC called Clocks Per Instruction (CPI), the average number of clock cycles it takes to retire one instruction (the lower the number the better). A core can retire two micro-ops per clock cycle; most instructions are one micro-op. The other instructions will cause the CPI to rise above 0.5 because they are multiple micro-ops.
The first step is to enable PMC values in PIX and System Monitor by enabling Retired Instructions per second for each processor core. (See Figure 1.)
Figure 1. System Monitor showing Retired instructions per sec on each CPU core.
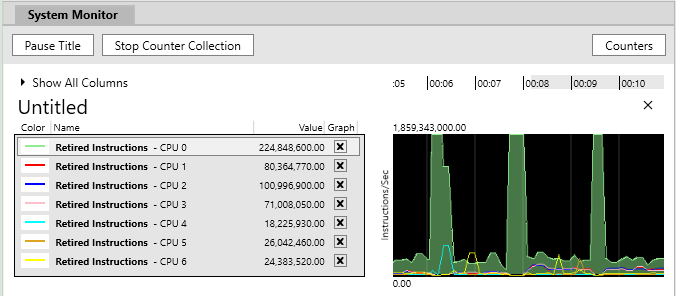
Each processor core runs at 1.75 GHz on Xbox One and Xbox One S, and at 2.3 GHz on Xbox One X. For each core, divide the frequency by the Retired Instructions per second. This number will be the Cycles Per Instruction (CPI) for the core. The average seen for shipping titles is approximately two. If the number is higher than two, the most likely cause is a data cache issue.
If the CPI is high only on one core, there may be a general cache miss, probably from a poor access pattern on data. If the CPI is high across multiple cores, there is a likelihood of data contention between threads. However, if the title has many threads that can float between cores, this could be a false positive of data-contention issues.
Function Summary/Callgraph Capture
If the CPI numbers derived from System Monitor are high, the next step is to use either the Function Summary Capture command or the Callgraph Capture command. Function Summary Capture will show overall time spent per function along with a chosen set of PMC values. The Callgraph Capture command allows you to drill down through a function and its children.
Function Summary Capture
This command is useful if problem areas are not known.
To locate general issues:
-
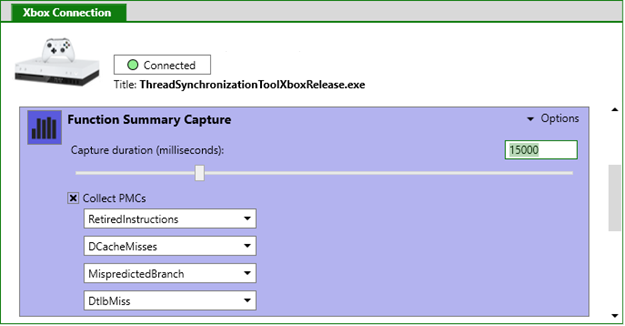
From System Monitor, select Options in the Function Summary Capture box to expand and see the options. Select PMCs for RetiredInstructions, DCacheMisses, BranchInstructions, and MispredictedBranch.
-
Start a Function Summary Capture. The default time of 15000 milliseconds is a good starting point. (See Figure 2.)
Figure 2. Function Summary Capture box from System Monitor.
- When the capture is complete, the capture summary page will be visible.
- Select the Function Summary tab at the top of the window.
- From the section at the top of the window, on the Events tab, select the following:
- Title Modules Only
- !CoreCrossing
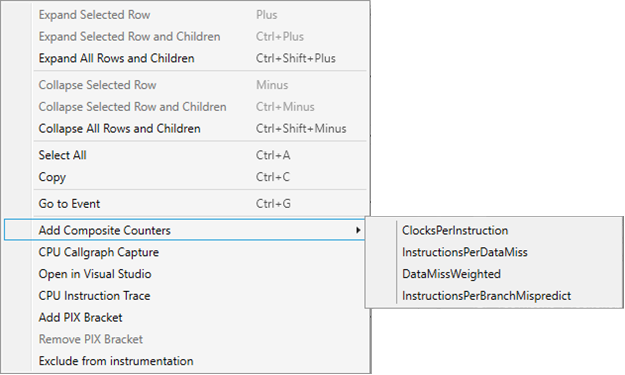
- From the right-click context menu, select Add Composite Counters and add the following counters: ClocksPerInstruction, DataMissWeighted, and InstructionsPerBranchMispredict.
Figure 3: Context menu showing composite counters
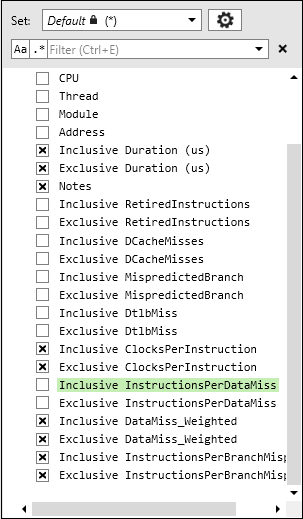
- In the Counters drop-down list, start with the following options selected, both inclusive and exclusive: Duration (μs), ClocksPerInstruction, DataMiss_Weighted, InstructionsPerBranchMispredict, and Notes. (See Figure 4.)
Figure 4. Counters view in both Function Summary and Callgraph displays.
- Sort by Inclusive DataMiss_Weighted. Look for title functions that stand out.
- If the highest functions work on local data, continue with instruction trace (later in this paper).
- If the highest functions work on shared data, the title may have a data-contention issue. Investigate the shared data and attempt to minimize access.
- Consider sorting by Exclusive DataMiss_Weighted.
- This will point to larger sections of code that may be having cache miss problems.
- Higher-level functions in this list make good candidates for Instruction trace (later in this paper).
- The same steps can be used with InstructionsPerBranchMispredict to locate functions that have a poor branch prediction ratios. You’ll need to investigate these functions directly to determine the root cause.
Callgraph Capture
This command is useful if the title has known locations in the code with issues.
To analyze known locations:
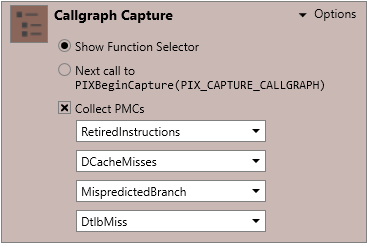
- From the System Monitor screen, select Options in the Callgraph Capture box to expand and see the options. Select the Show Function Selector option. Select PMCs for RetiredInstructions, DCacheMisses, BranchInstructions, and MispredictedBranch. (See Figure 5.)
Figure 5. Callgraph Capture drop-down menu from System Monitor.
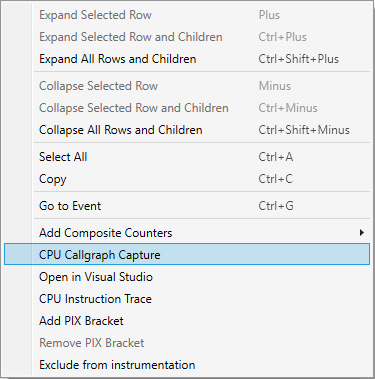
- Or from the Function Summary menu, select CPU Callgraph Capture on the context menu for the function. (See Figure 6.)
Figure 6. Context menu for a function in the Function Summary.
-
In the Callgraph window, select the counter display.
-
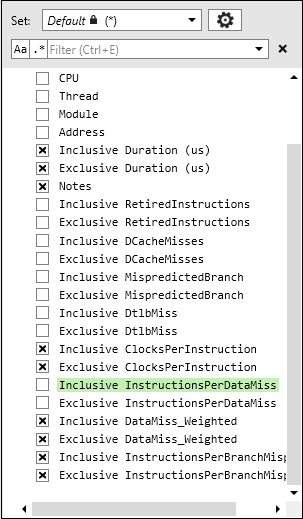
In the Counters drop-down list, start with the following options selected, both inclusive and exclusive: Duration (μs), ClocksPerInstruction, DataMiss_Weighted, InstructionsPerBranchMispredict, and Notes. (See Figure 7.)
Figure 7. Counters view in both Function Summary and Callgraph displays.
- Sort by Inclusive DataMiss_Weighted. Look for title functions that stand out.
- If the highest functions work on local data, continue with instruction trace (later in this paper).
- If the highest functions work on shared data, the title may have a data-contention issue. Investigate the shared data and attempt to minimize access.
- Consider sorting by Exclusive DataMiss_Weighted.
- This will point to larger sections of code that may be having cache miss problems.
- Higher level functions in this list make good candidates for Instruction trace (later in this paper).
- The same steps can be used with InstructionsPerBranchMispredict to locate functions that have a poor branch prediction ratios. You will need to investigate these functions directly to determine the root cause.
Instruction trace
There are two very useful instruction trace strategies:
- Full frame trace – Gives a good overall view of how the title performs across the entire frame.
- Function trace – Useful if you already have a good idea of where the issue might be.
To capture instructions for a full frame or a specific function:
-
Make sure you are on a computer with at least 16 GB of memory; even more is preferable because instruction traces can generate a large amount of collected data.
-
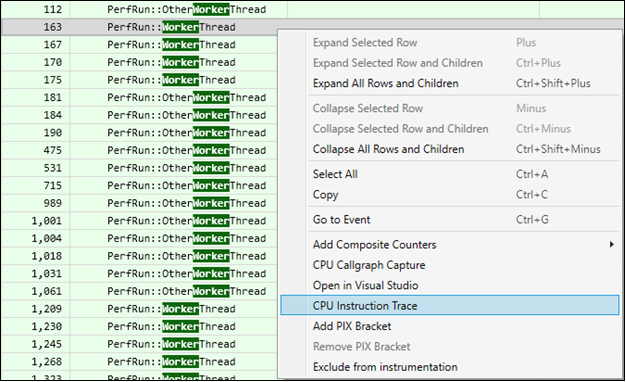
From either the Function Summary or Callgraph window, select CPU Instruction Trace from the context menu of a high-level function that covers the entire frame. (See Figure 10.)
- You can also select any lower function to focus on specific areas, for example a high-level entry point for the animation system.
Figure 10. Starting an instruction trace from a function.
-
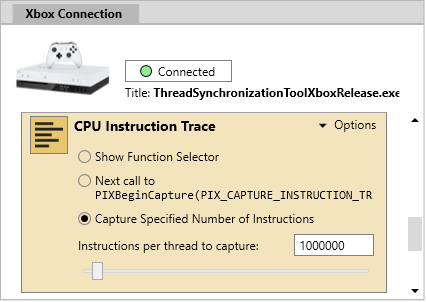
Another option: In System Monitor, select the Capture Specified Number of Instructions option in the CPU Instruction Trace box to indicate the approximate number of instructions per thread to capture. (See Figure 11.)
- To get an approximate count, use the Retired Instructions per second PMC for the heaviest used CPU core. Multiply that number by the number of cores used and then divide by the frame rate and the number of threads.
Figure 11. Full frame instruction trace started from the System Monitor.
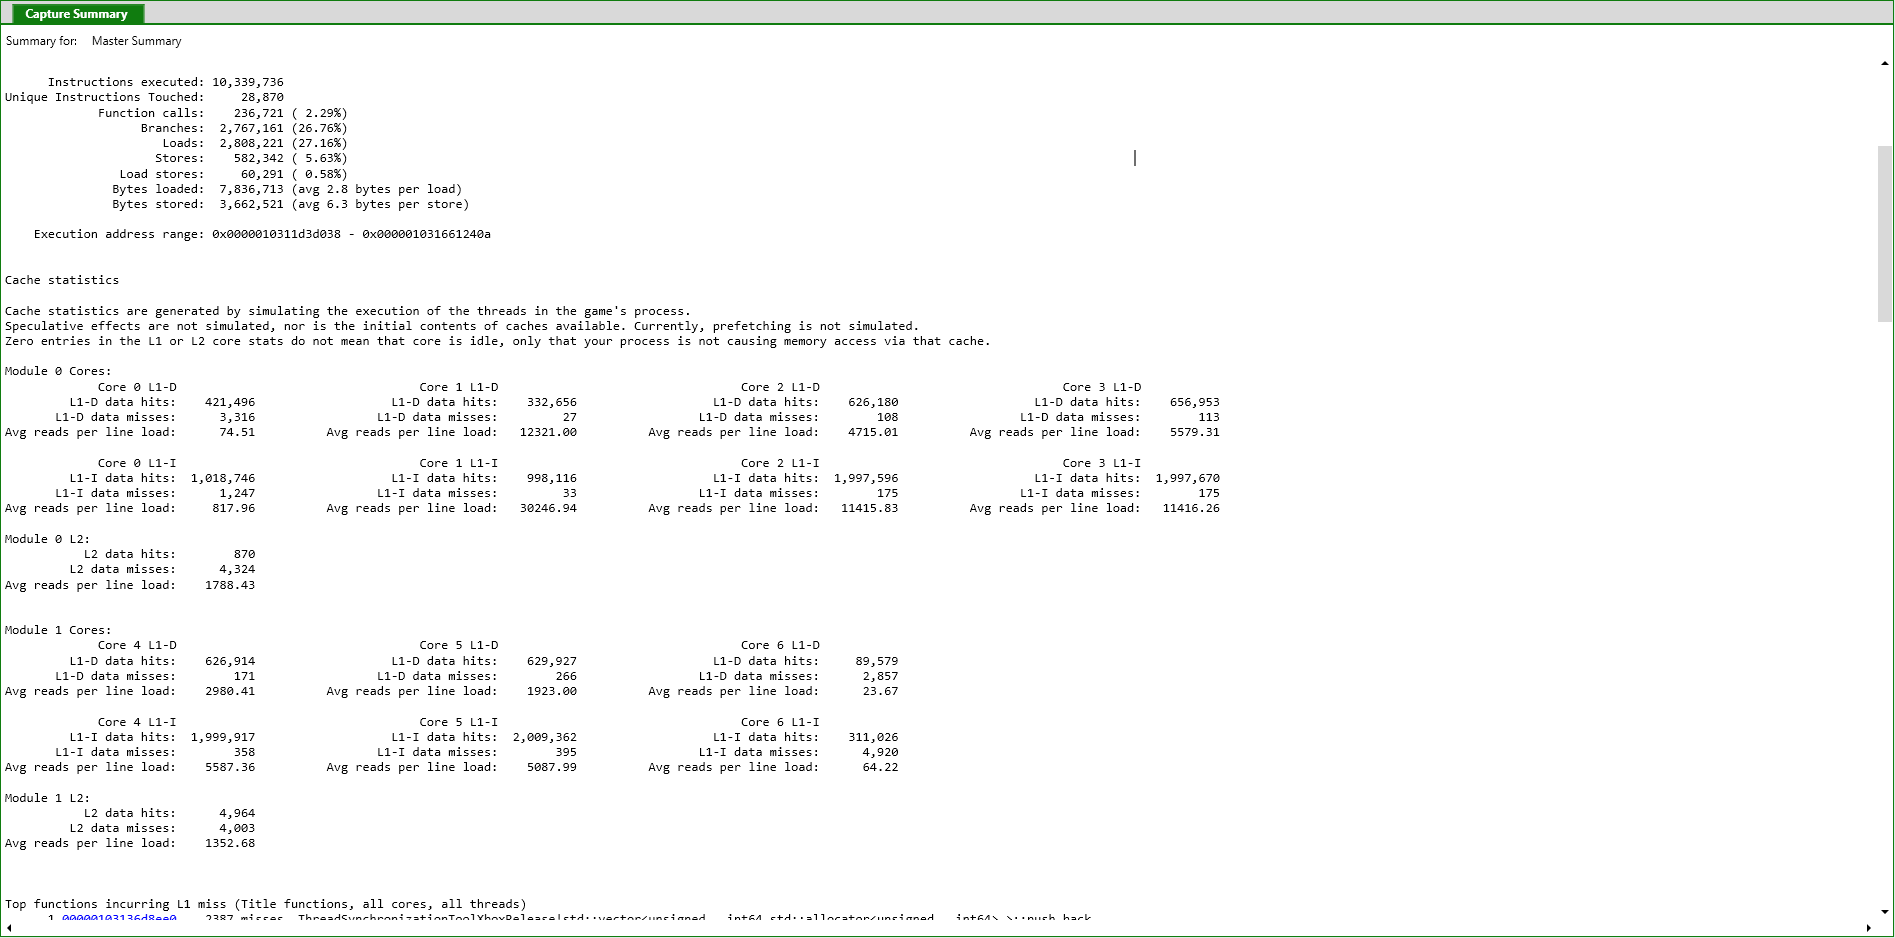
The Trace Summary window is the main window showing overall statistics on how the title performed during the trace. The two blocks of data at the top give overall numbers. Below these blocks are quick links to the worst offending functions (See Figure 12.)
Figure 12. Trace Summary window showing overall cache statistics.
Execution summary
- Loads – Number of instructions that issued a load
- Stores – Number of instructions that issued a store
- Load stores – Number of instructions that issued a load store
- Bytes loaded – The total number of bytes requested for a load
- Bytes stored – The total number of bytes requested for a store
Cache statistics
- Data hits – Number of requests that hit the data cache
- Data misses – Number of requests that missed the data cache
- Average reads per line load – Number of load instructions / Number of cache misses
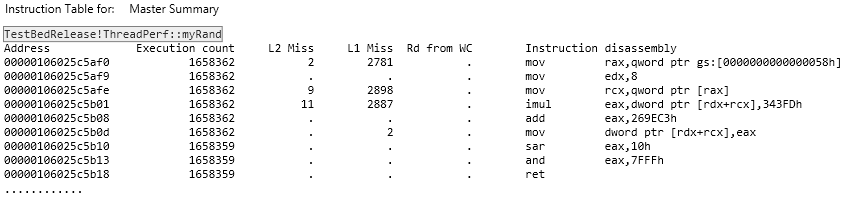
Clicking the address for any of the top offenders will display the assembly of the function in question. Columns for execution count and cache misses are shown per line. (See Figure 13.)
Figure 13. Instruction Table for myRand function from instruction trace.
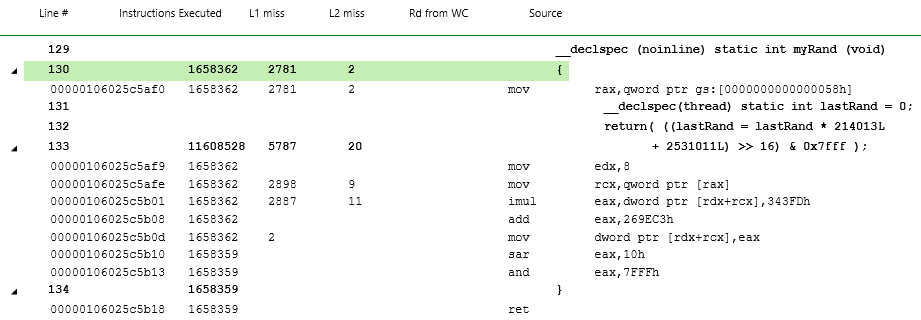
The context menu of a function allows the option to view the source for the function. Columns for execution count and cache misses are shown per line of the source. (See Figure 14.)
Figure 14. Instruction Table with source overlaid for myRand function from instruction trace.
To locate issues at the instruction level:
- Starting with the Master Summary, look at the top functions incurring an L1 miss.
- Select the address link to view the assembly.
- Review the assembly for hot spots on cache misses.
- Alternately use the context menu to view the cache misses per line.
- For each cache miss, determine the cause.
- If no cache issues are apparent, there might be a false sharing issue with another thread. Check locality of data in the title code and compare against data used on another thread.
Memory Map
Instruction trace supports the ability to view the areas of memory touched during the capture across the entire addressable range of your title.
- Select the Memory Map tab at the top of the instruction trace.
Figure 15. Initial Memory Map screen.
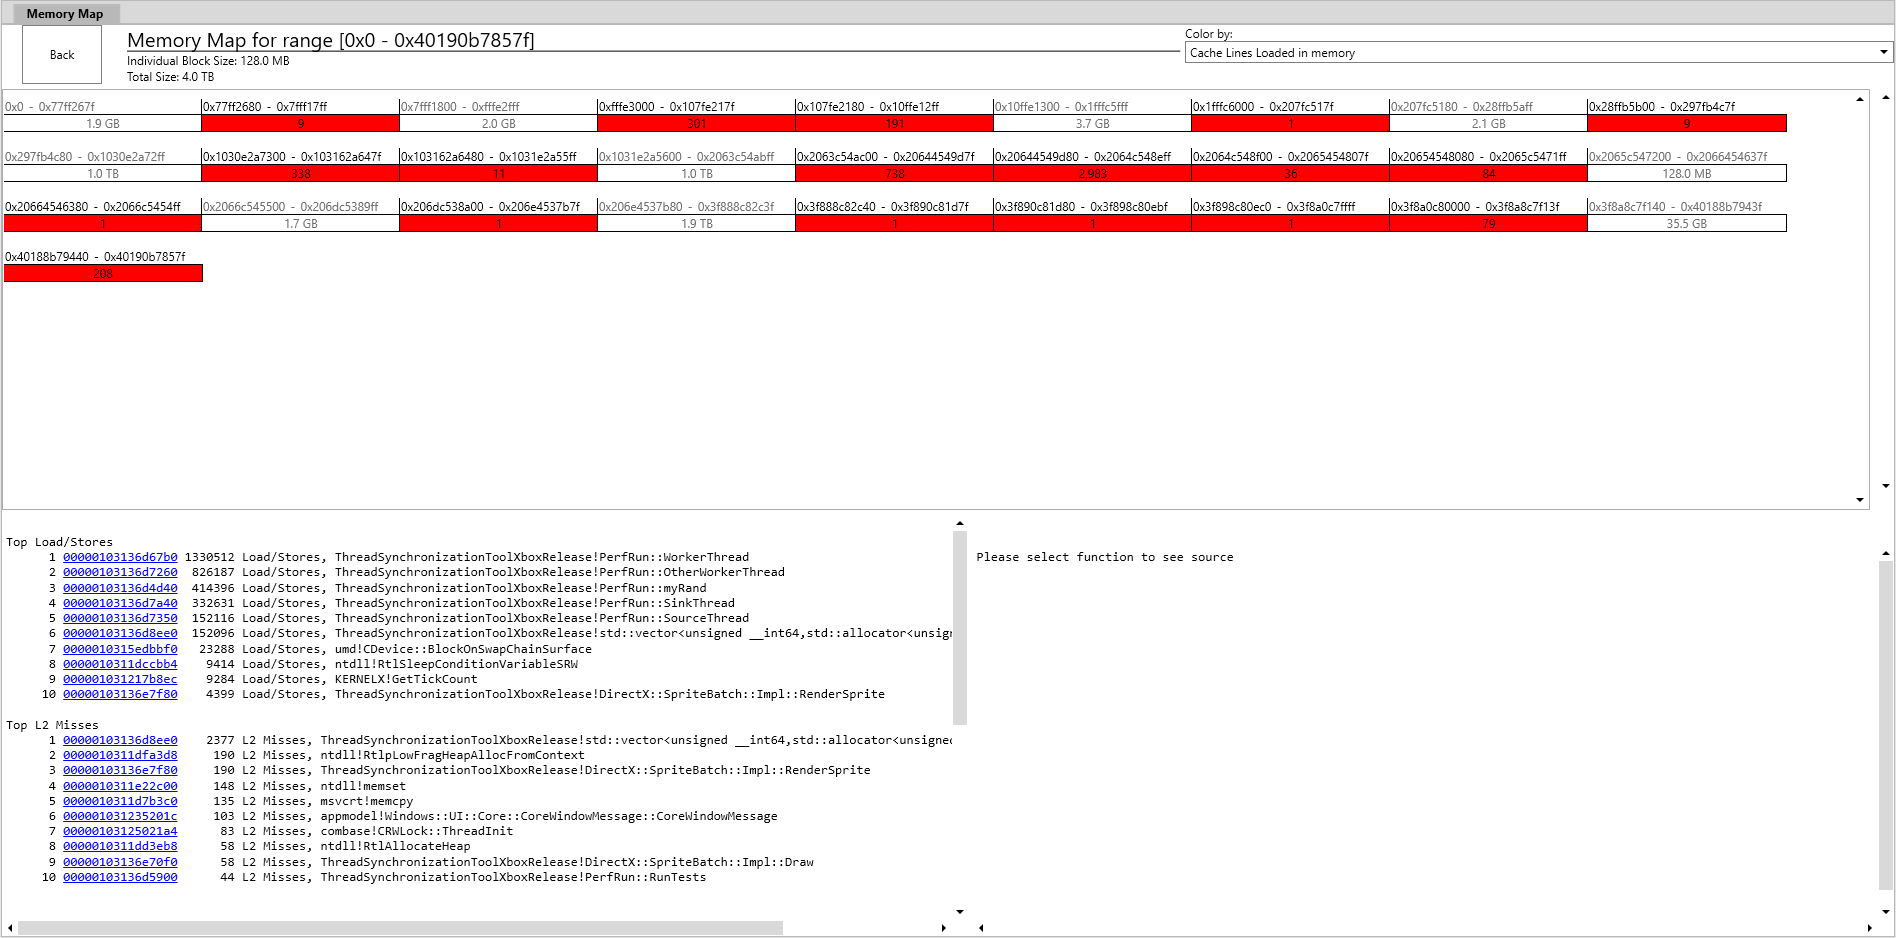
- The top of the window shows all the sections of memory touched by the capture. It will start initially with the entire range of memory available to your title.
- The bottom-left portion of the window contains a list of the top cache accesses, plus the top cache miss functions for the visible section of memory.
- Select a function in the list of interest. This highlights both the areas of memory touched by the function and the source code for the function.
Figure 16. Memory Map window with single function selected, showing highlight of addresses touched.
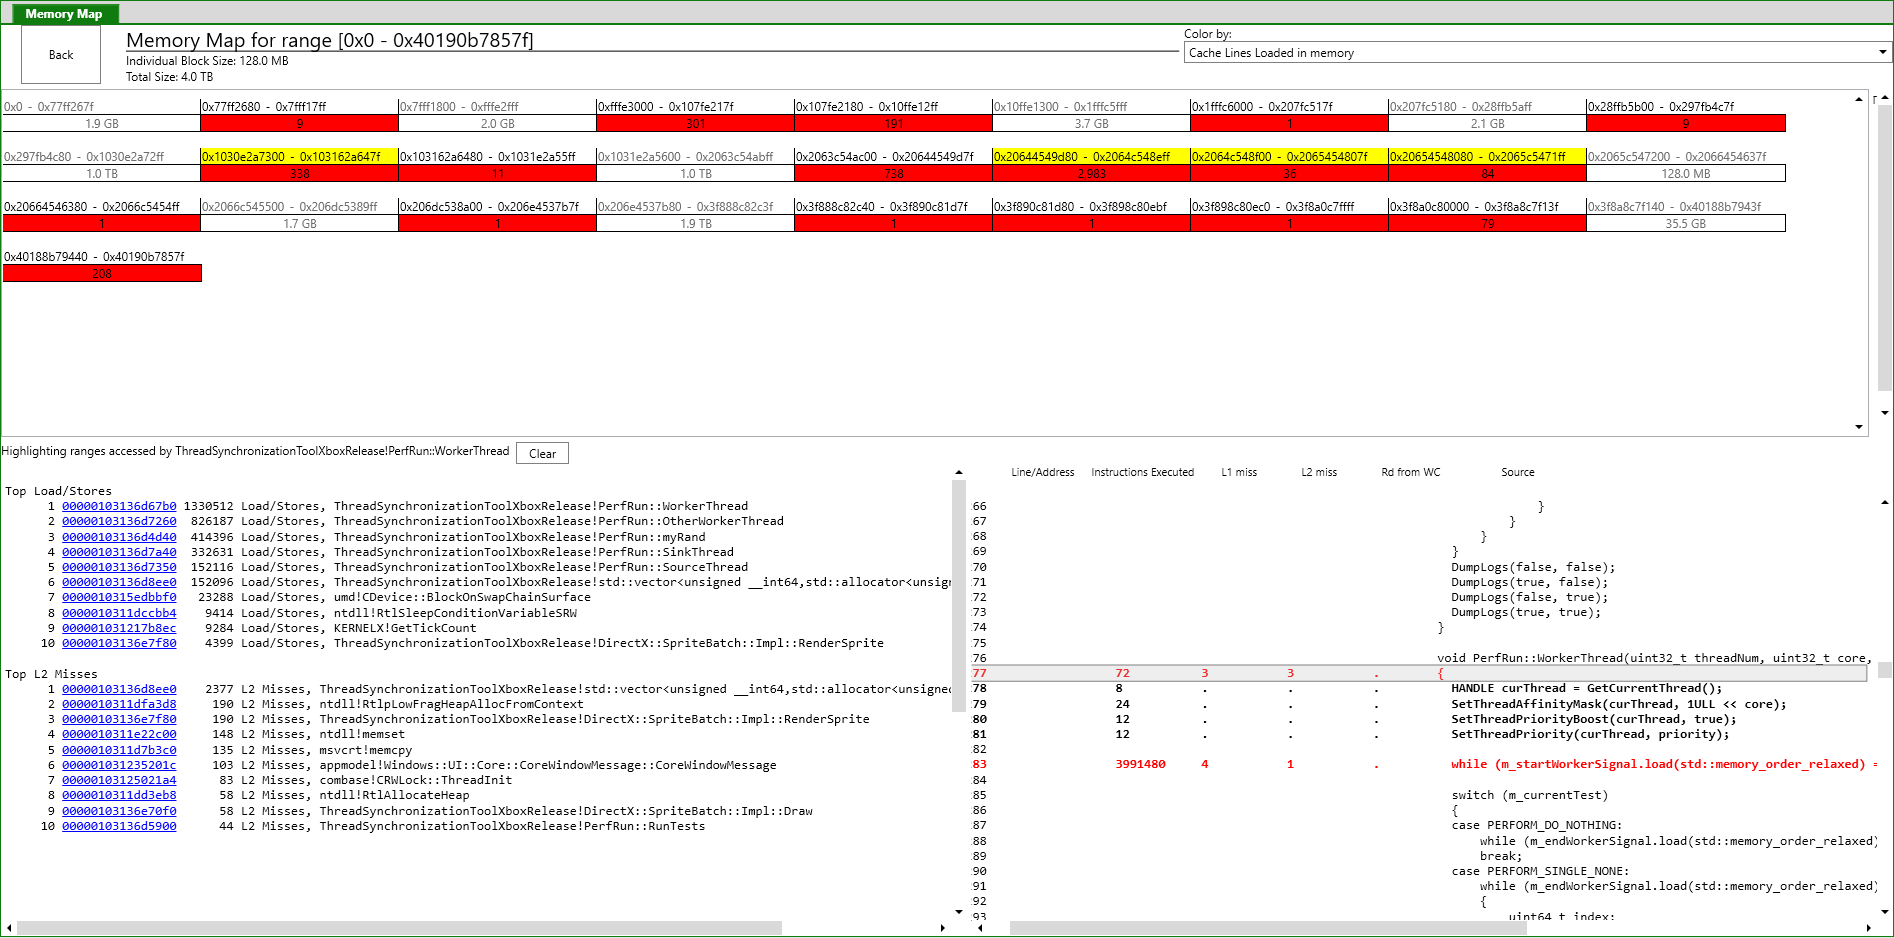
- Click a block to zoom in to that address range.
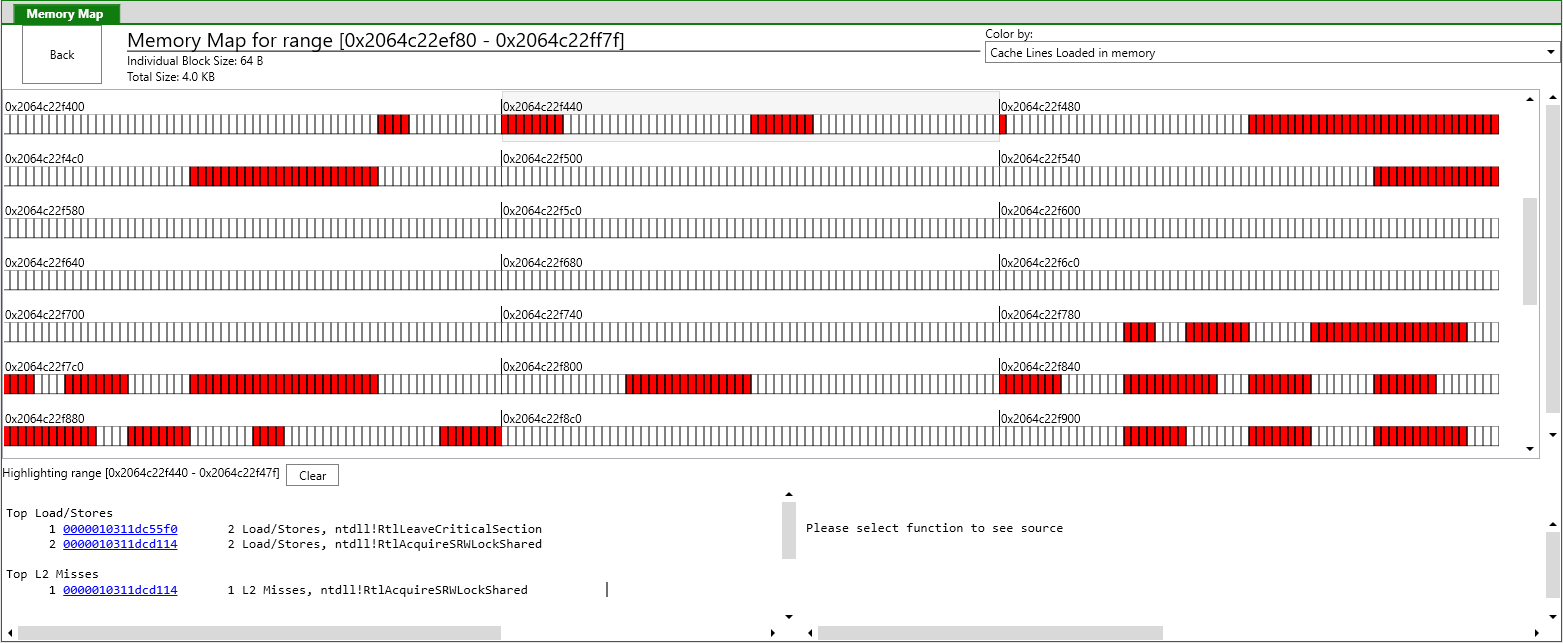
- Continue to zoom in until you get to the individual cache line view.
Figure 17. Memory Map window zoomed into the individual byte and cache line level.
-
Each block represents one byte of memory with larger blocks for each cache line.
You’re looking for areas where the full cache line is not being used.
For example, figure 17 shows many sections where parts of the cache line are not being used. This is a good indicator of poor layout of data within the program, which can lead to higher cache misses.
-
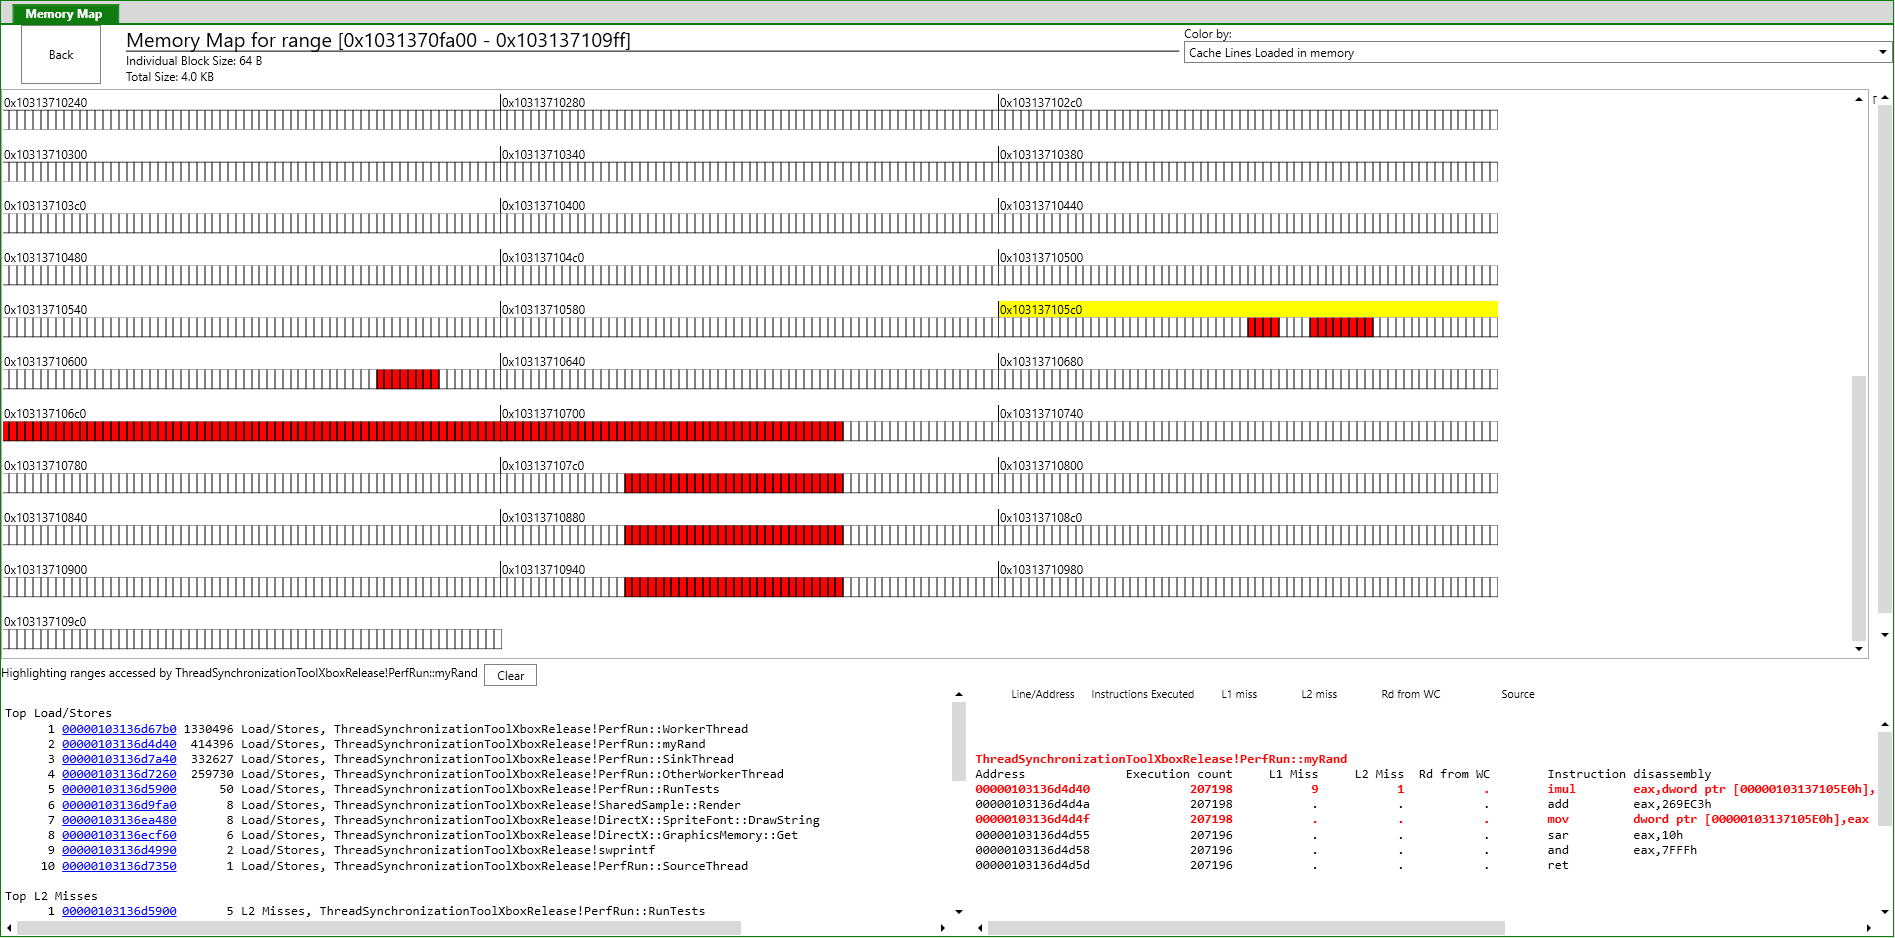
Select any function in the list to highlight which blocks are being accessed by this function and the corresponding source code.
Figure 18. Memory Map window showing individual bytes touched by a function.
-
In figure 18, you can see that only 12 bytes are being used, of the entire 64 bytes available in the cache line.
This might be a good spot to consider adjusting the packing of memory, especially if it was one of the poor cache-usage functions. Access that’s spread out across memory requires more cache lines to be touched, which directly relates to a higher cache miss rate.
Common causes of poor cache usage
- Loading from random addresses—Consider ordering memory accesses.
- Looping through data that is larger than the cache size—This causes the cache to be cleared just before the data is requested again. Consider looping through smaller blocks of data.
- Looping through data too fast—A certain amount of time is needed to load from memory; consider using prefetch earlier in the loop.
Summary
Following these steps should put you well on your way to locating the cause of common data cache issues and branch misprediction issues. If any of your questions were not answered, please visit the Developer Forums. There is a wealth of information there along with people who can help answer your questions.