Andrew Farrier, Advanced Technology Group
Updated September 8th, 2017
No Problem: A Practical Look at PIX
In this topic
Introduction
The Performance Investigator for Xbox, or PIX as it’s more commonly known, is the primary tool used by the Advanced Technology Group for analyzing CPU and GPU performance of games. It is included with the XDK and can be used by anyone developing Xbox One games. With minimal setup, it can provide detailed information about your game, including:
- Memory leaks (Memory Allocation Capture)
- GPU operations (GPU Capture)
- When files are accessed (File IO Trace)
- L1 and L2 performance (CPU Instruction Trace)
Using the PIX API to instrument your code can give you even more detailed information. Instrumenting code is not necessary for using PIX, but there are a few simple steps that you need to do before a PIX capture can be made. You can find details on how to set up PIX on the PIX setup page of the XDK documentation.
Scenarios
Random crash after long play session: finding memory leaks
Some of the most daunting bugs to diagnose are those that don’t have clear repro steps. If you’re seeing crashes that appear in non-deterministic areas of a game or application, one likely culprit is a slow memory leak. Xbox One and Xbox One S provides games with 5 GB of memory, plus an extra 768 MB of memory that can be accessed during development. Xbox One X increases the available memory to 9 GB, with an additional 12 GB available on the Xbox One X development kit. Consider a hypothetical game under development with a peak memory utilization of 4 GB. If our hypothetical game ran at 30 frames per second (fps) and leaked 4 KB of memory per frame on Xbox One (a particularly bad memory leak), it would take almost two and a half hours of playtime before memory allocation would fail, or over four hours with debug memory enabled.
Note: The extra time to crash with debug memory enabled assumes the use of the PIX_Title value for the debug memory mode. If PIX_Tool or PIX are used, the standard 5 GB of memory will be available through normal memory allocation. For more information about setting debug memory modes, check the DebugMemoryMode key for the xbconfig command-line tool.
The Memory Allocation Capture feature of PIX was added with the February 2015 XDK to help track down such memory leaks. Before this, the only insight into memory usage provided by PIX was the use of performance counters tracking total memory usage. Now if a memory leak exists, it is easy to see by using the Title Used Memory and Title Available Memory counters as well as the memory usage bar near the top left of the main window.
Figure 1. Useful memory counters (on right) and the corresponding graph for some counters
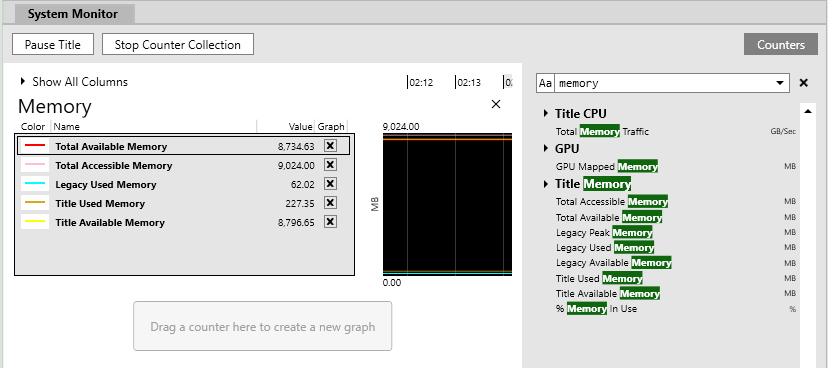
Note: Memory allocations are split into two categories: Title allocations and Legacy allocations. Title code has direct control over Title allocations, which are made up of all platform and title allocations made through XMemAlloc as well as allocations made through VirtualAlloc with the MEM_GRAPHICS or MEM_TITLE flags. Legacy memory usage represents all other memory allocated with VirtualAlloc, memory required to load an executable, and thread stacks. Some legacy memory usage is not under title control. However, using new and delete to manage memory will show up as legacy memory. Memory should not be allocated with new and delete.
Figure 2. Memory Allocation Capture options
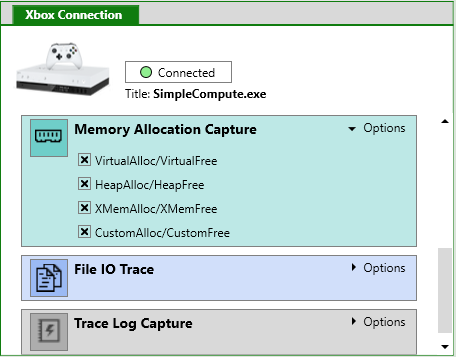
Before initiating a Memory Allocation Capture, you can select whether to capture allocations made through VirtualAlloc, HeapAlloc, XMemAlloc, custom title allocators, or any combination of these. See PIX Custom Memory Allocators for additional details on capturing allocations made by custom allocators. After the capture is initiated, it will run for as long as you allow it. Information about memory allocations will then be displayed on the capture summary page, which is a list of every allocation made while the capture was running paired with each call to free that memory. If there was no corresponding call, it’s possible there was a memory leak. However, this is not always the case because the call to free the memory may have occurred after the capture was completed.
Figure 3. List of all allocations made. Given the volume of data presented, it’s best to filter aggressively. Use the !Freed filter to view only allocations that weren’t paired with a call to free.
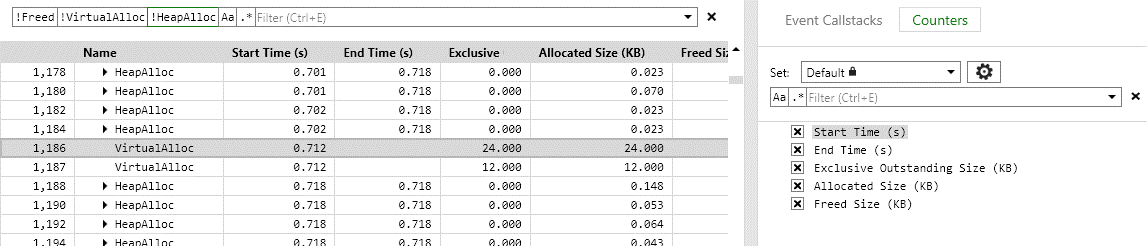
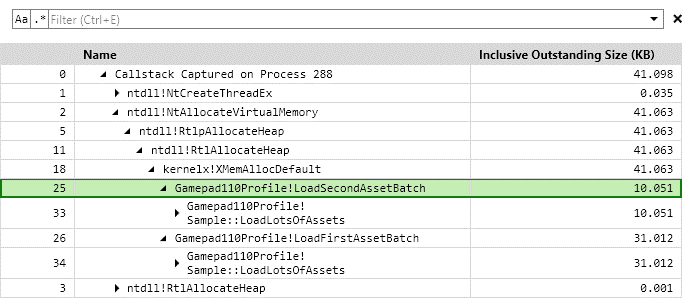
The Callstack page of the capture (see Figure 3) summarizes which functions were responsible for allocating memory. The interesting data shown here is in the Exclusive Outstanding Size (KB) column. It shows the amount of memory allocated by a function that was unaccounted for by a subsequent call to free the memory. This is a different way to visualize possible memory leaks. If memory is managed in your game concisely, the expectation is that most allocations will have similar call stacks. The call stack view is a good way to spot superfluous or unexpected allocations from portions of code where they shouldn’t be made.
Figure 4. In this example, the “LoadSecondAssetBatch” and “LoadFIrstAssetBatch” functions have large amounts of memory that isn’t accounted for. This would be the first place to look for a possible memory leak.
Memory management resources
- PIX Memory Captures for more details on using the Memory Capture feature of PIX
- Xbox One Memory Performance white paper
GPU running slowly: adjusting bandwidth
Xbox One is a complex system in which its separate parts all work in concert with each other. When the interactions between the different components are carefully considered, they can be leveraged to their maximum potential. However, it’s easy to have the CPU and GPU attempting to use the same resources, and this results in disproportionate slowdowns of the GPU.
The GPU on Xbox One and Xbox One S has access to both ESRAM and DRAM; the CPU only has access to DRAM. If the GPU is working exclusively in ESRAM, there is no danger of memory bandwidth contention. However, sometimes it is necessary for the GPU to copy data between DRAM and ESRAM, and the maximum theoretical bandwidth for this movement is 68 GB/s. In practice, the maximum throughput is generally closer to 50 GB/s. However, if the CPU is also accessing DRAM, there will be some contention for memory bandwidth. The bandwidth used by the CPU slows down the GPU bandwidth at a rate of roughly 2 to 1. This means that if the CPU is using 5 GB/s of bandwidth, the GPU may only achieve a maximum of 40 GB/s. GPU performance can be greatly diminished if the CPU is taking too much bandwidth.
Figure 5. How the main PIX window should look with a few common GPU counters: the frame rate is steady at 200 fps and the frame duration is consistent.
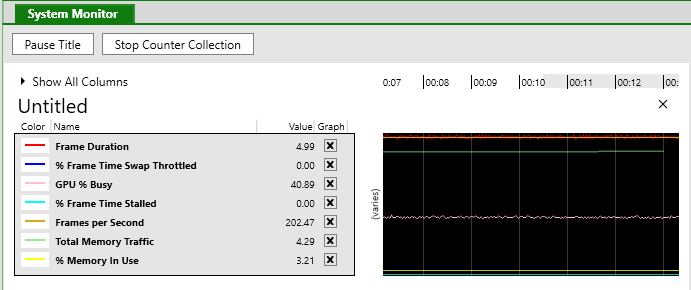
A few relevant performance counters you may find interesting include:
- D3D: Frame Duration: If the GPU is stalled, this counter will be consistently high. In some cases, it will spike intermittently, indicating that a single frame took much longer than expected.
- CPU Traffic: Measures the amount of IO traffic the CPU is responsible for. If this is too high, it can cause the GPU to run more slowly than expected if the GPU needs to access DRAM.
- Onion Bus Traffic: Measures the traffic on the ONION bus. The ONION bus handles traffic between the memory controller and the GPU with the ability to interact with the CPU cache. On Xbox One it is capable of up to 30 GB/s read throughput and 15 GB/s write throughput. Xbox One X increases this to 40 GB/s read and 20 GB/s write.
- Garlic Bus Traffic: Measures the traffic on the GARLIC bus. The GARLIC bus handles traffic between the GPU and DRAM. It has a maximum throughput of 68 GB/s on Xbox One. Xbox One X increases this to a maximum of 326 GB/s.
Note: Although it is popular to talk about frame rate as a benchmark, it is often more practical to use frame time or duration as a key performance indicator. Consider using the D3D: Frame Duration counter as your main performance indicator instead of frame rate.
If the CPU and GPU are fighting for bandwidth, graphics performance can be greatly affected. For example, Figure 6 shows what the main PIX window will look like if several memory copy operations are occurring simultaneously, such as memcpy_s.
Figure 6. What may happen if your CPU is using a large amount of memory bandwidth: the frame time is bouncing between 13ms and 26ms, and the frame rate is inconsistent.
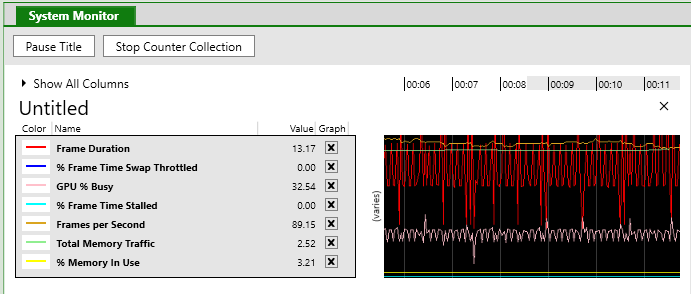
Notice that the Frame Duration is erratic. In this scenario, core 0 is handling the rendering thread; this is identical to the capture in Figure 5. The only difference is that cores 1-5 are all performing memcpy_s operations, pulling memory bandwidth away from the GPU. The result is a slow and inconsistent frame rate despite plenty of CPU and GPU power to spare.
Note: Strategically moving data to ESRAM can greatly improve GPU performance as long as it’s used wisely. See Using PIX for GPU performance for more details on using PIX GPU captures for additional analysis and testing. For example, moving resources into and out of ESRAM to see how performance is affected. In general, if a resource does not need to be updated frequently by the CPU, it should reside in ESRAM.
Xbox One X memory has a much higher available memory bandwidth: 326 GB/s. It also does not contain ESRAM, which means all memory access by the GPU will be to DRAM. The ratio of available bandwidth between the CPU and GPU has changed drastically, though. On Xbox One it was in the 3.4 to 1 range, but on Xbox One X it’s in the 12 to 1 range. Testing has shown that the CPU cannot saturate the bus enough to affect the GPU.
GPU memory performance resources
- Xbox One GPU Memory Access white paper
- Caches and Coherency on the Xbox One GPU white paper
- Graphics Performance Tools presentation (Xfest 2015)
Excessive load times: tracking file IO
Excessive load times can be a killer for the player’s experience. Your game is guaranteed to have at least 40 MB/s (Xbox One/Xbox One S) or 60 MB/s (Xbox One X) of file IO bandwidth over any two-second window from the system. There may be some variance depending on the load on the system outside of your title, but the details are outside the scope of this white paper. For now, the assumption is that you’re looking for at least 40 MB/s of bandwidth on Xbox One/Xbox One S, or 60 MB/s on Xbox One X.
The File IO Trace feature was added to PIX in the March 2015 XDK and can be used to profile reads from, and writes to, the hard disk. If you believe the load times are becoming excessive, or you see a large jump in load times after an update to your game code, this tool can be used to check whether this is due to larger amounts of data or slow file IO operations.
Figure 7. Initiate a File IO Trace by using the button in the main window. A window will appear allowing you to specify when to stop scanning for disk read and write operations.
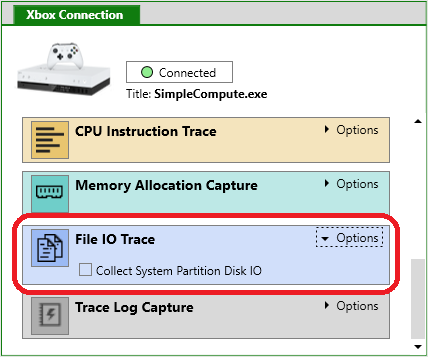
The speed of file IO can vary greatly depending on how files are laid out on disk and how the operation is managed at runtime. Follow these guidelines to maximize throughput:
- Prefer contiguous reads over fragmented reads. Reading from one portion of the disk and then reading from a different portion of the disk causes excessive spinning and seeking of the hardware, which leads to longer read times.
- Prefer asynchronous read operations over synchronous read operations. Even if synchronous read operations are done one immediately after the other in title code, there is some small amount of time between the end of the first read and the beginning of the second read. Using asynchronous reads allows the system to queue up operations, thus reducing the wait time between read operations. When multiple reads are queued up at once, the system can also reorder them to minimize the time spent waiting for the hard disk to spin to the next file read location.
- Use FILE_FLAG_NO_BUFFERING whenever possible. This flag requires the amount of data read be a multiple of 4 KB. However, it does not buffer that data in the cache. Without the flag, file data is buffered in the cache, which may evict existing data. This may not have an immediate effect on IO performance, but may incur cache misses that could have otherwise been avoided.
After initiating the trace, it will continue to run until you stop it. The indeterminate run time allows the flexibility to capture the sections of your game where file read operations are happening and stop them after the interesting data has been captured. Figure 8 shows how a capture would appear in PIX.
Figure 8. A file IO trace captures when streaming assets from the file “meshes.zip” are requested. Each read event corresponds with a burgundy portion of the timeline under the graph. It also shows total throughput and disk utilization.
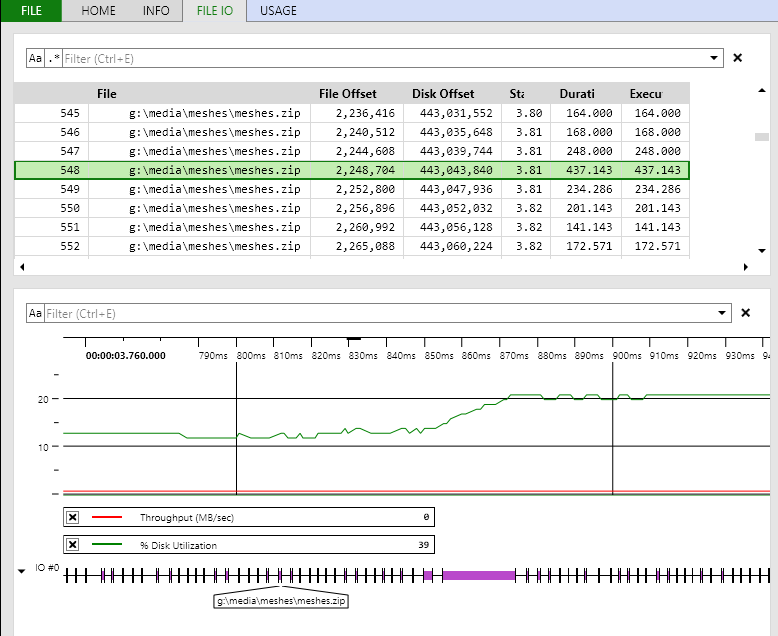
Several columns are available, all of which may be interesting. These are the columns which will be best for determining your file IO efficiency:
- IO Size – The number of bytes read during one operation.
- Execution Time – The amount of time spent on the read operation by the disk. This will always be equal to or less than the Duration because it will not include any time in which the read operation was delayed.
- Duration – The amount of time from the start of the read operation to the end of the read operation in microseconds. This value is also known as the IO Time in the Windows Performance Analysis (WPA) tool. This is distinguished from the Execution Time in that it includes all the time in which a read was stalled or delayed for any reason, such as queueing time.
- File – The full path to the file of the operation.
- File Offset – Indicates the position in the file of where the read is initialized. This is especially useful when multiple assets are packed into the same file.
Use the XbStress tool to better simulate real world scenarios. Xbox One is not a single process system. Other processes may be performing disk operations at the same time as your game, such as system processes or pending connected storage writes. The commands >xbstress start disk=100 and >xbstress stop are enough to get started. For more information about using XbStress, see Stress (xbstress.exe) in the XDK documentation.
For the most accurate numbers, use encrypted builds and Push deployment when analyzing the performance of file IO. Run from PC and unencrypted builds will have different performance metrics than you would see in retail.
Optimizing file IO and loading times resources
- PIX File IO Captures, for more details on using PIX and file I/O captures.
- Designing Title Package Layouts for Updates white paper
- Maximizing File Performance white paper
- Finding Loading Issues white paper (GDN)
- Less Waiting and More Playing presentation (Xfest 2015)
- IO, Storage, and Content Update Best Practices presentation (Xfest 2014)
Low frame rate: finding cache misses
A game may be running slowly for myriad reasons. Code that incurs frequent cache misses will run significantly more slowly. Accessing data in the local L1 cache requires 3 cycles, and the local L2 cache requires 17 cycles. If the data isn’t in the local cache, accessing it requires more than 120 cycles. Not only are cache misses expensive, they’re very difficult to spot by reviewing code through traditional means.
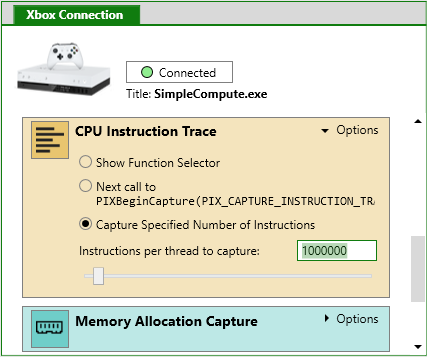
This is where the Instruction Trace feature of PIX can be of great use. The primary purpose of an instruction trace is to determine which functions and specific instructions incur cache misses. While your game is running, an instruction trace can be captured by using the CPU Instruction Trace button at the top of the main PIX window.
Figure 9. Instruction traces can be kicked off from the main PIX page; the options allow you to modify the number of instructions included in a trace.
The Trace Summary page (Figure 10) shows overall information about the trace that was captured; it includes a list of functions which incurred the most L1 and L2 cache misses. This page may include a great deal of information that you do not find interesting, such as system functions that incur cache misses that you won’t have control over. The pane on the right of this screen allows you to narrow down your search by module or thread.
Figure 10. An instruction trace contains a lot of information. Use the pane on the right to filter by thread.
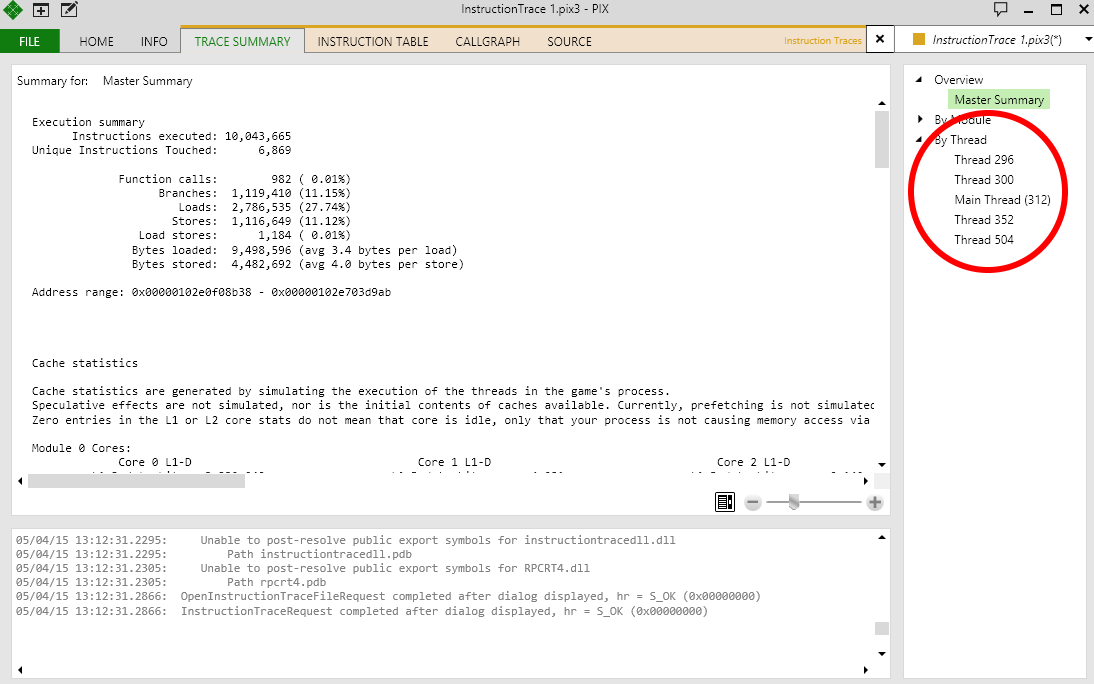
By default, threads will be listed based on an opaque thread ID. Threads can be given names using the SetThreadName API. Figure 10 shows an example of a game running on a single thread named “Main Thread” while all other threads are system threads. We strongly encourage you to give threads logical names to make them more easily identifiable in PIX, such as “Rendering Thread” or “Physics Thread.”
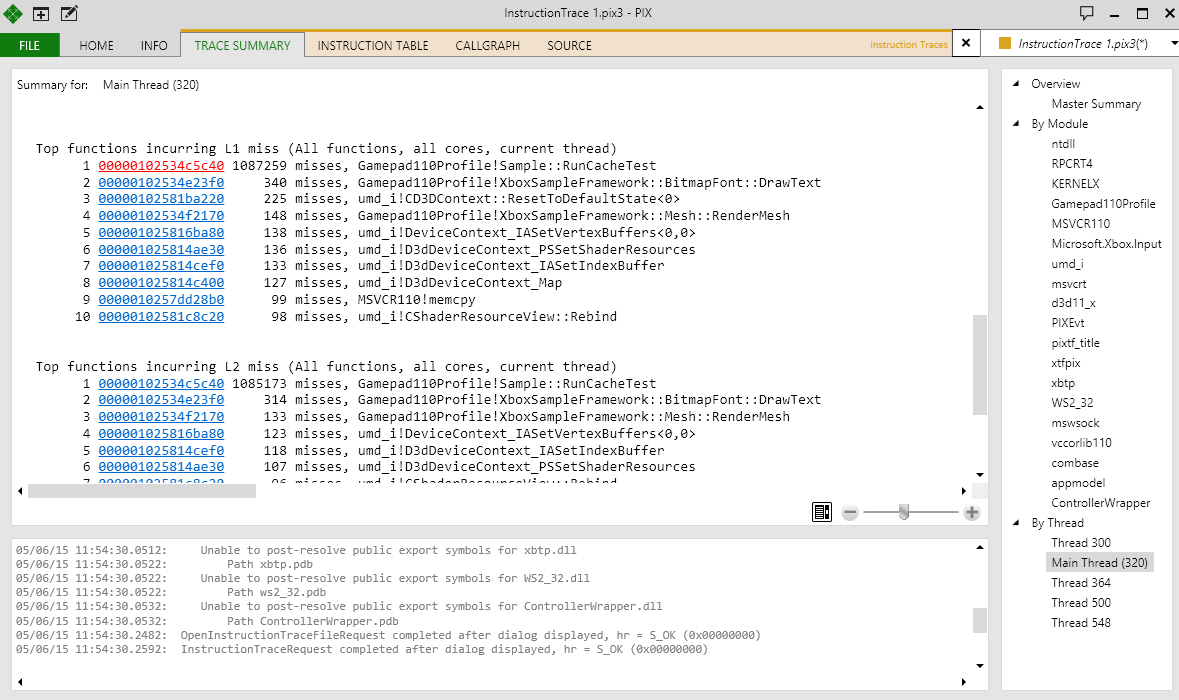
In Figure 11, a single function on the main thread is incurring a large number of L1 and L2 cache misses. Clicking the hyperlink next to the item brings up the function in the Instruction Table.
Figure 11. Right-clicking this screen opens a context menu that allows you to open the offending function in PIX or Visual Studio. For more details about cache statistics, check the Callgraph tab or Instruction Table tab.
Note: Although the Instruction Table page appears to be disassembly, this is not the case. It is a list of all instructions executed during the capture. If instructions exist in memory, but were not executed during the capture, they will be represented by “…” in the Instruction Table. There is also “…” between any two functions listed in the table.
Although it was not used in this example, the Callgraph page shows a great deal of useful information as well. If you’d like to examine a specific function, the Callgraph page is the place to do it. The filter at the top of the Callgraph page allows you to filter the results. Simply type in the name of the function you’d like to examine, and any functions that do not contain that string will disappear. The function may not appear right away; instead, its calling function will appear in the list. The parent function can be expanded until the function you’ve specified is visible.
General performance resources
- PIX Instruction Trace Capture, for more details on using PIX Instruction Trace
- Xbox One Memory Performance white paper
- Xbox One Memory System white paper
- Xbox One CPU Introduction white paper
- Finding Cache and Branch Issues white paper
- Instruction Trace on Xbox One presentation (Xfest 2015)
- Profiling and Optimization Tools on Xbox One presentation (Xfest 2015)
- Top CPU Performance Issues presentation (Xfest 2015)
- PIX CPU Profiling Tools Update presentation (Xfest 2016)
- ATG’s Hit-List of Common Performance Issues presentation (Xfest 2016)
- PIX CPU Tools Update presentation (Xfest 2017)
- Traits of Top-Performing Games (And What They Look Like In Pix) presentation (Xfest 2017)
Summary
PIX is a powerful tool with a plethora of applications. Since the launch of Xbox One, it has been continually improved to be more powerful and easier to use. In the past, using PIX effectively would have required specialized knowledge and the patience to ramp up with a new, advanced tool. That is no longer the case. With minimal setup and only a few changes to your build, PIX will provide valuable information that can be used to optimize your code.
The lower bar to entry doesn’t mean PIX has become any less powerful. Advanced users can still leverage PIX APIs to instrument code at runtime and dive extremely deep into the fine details of a single GPU frame. However, those large upfront investments in time and engineering efforts are no longer needed to gain a better understanding of your code.