PIX Instruction Trace Captures
Overview
The Instruction Trace view in PIX enables an instruction trace for a particular function, or a capture to be made of the next CPU instructions.
Capture Process
To make a CPU instruction trace capture
- Select the CPU Instruction Trace icon on the HOME view, and, if required, change the number of CPU instructions from the default of one million.
Figure 1. Instruction Trace tab: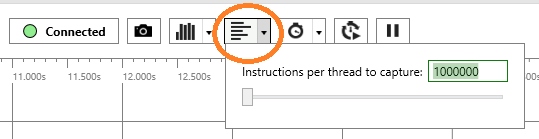 Alternatively, to get an instruction trace for a particular function, select the CPU Instruction Trace right-click menu item from either the function summary capture or callgraph capture.
 - After you’ve taken the capture, select the TRACE SUMMARY, and then narrow the data down to either a particular thread or a particular module.
Figure 2. Instruction Trace: Trace Summary view of a scene from the Deferred Particles sample: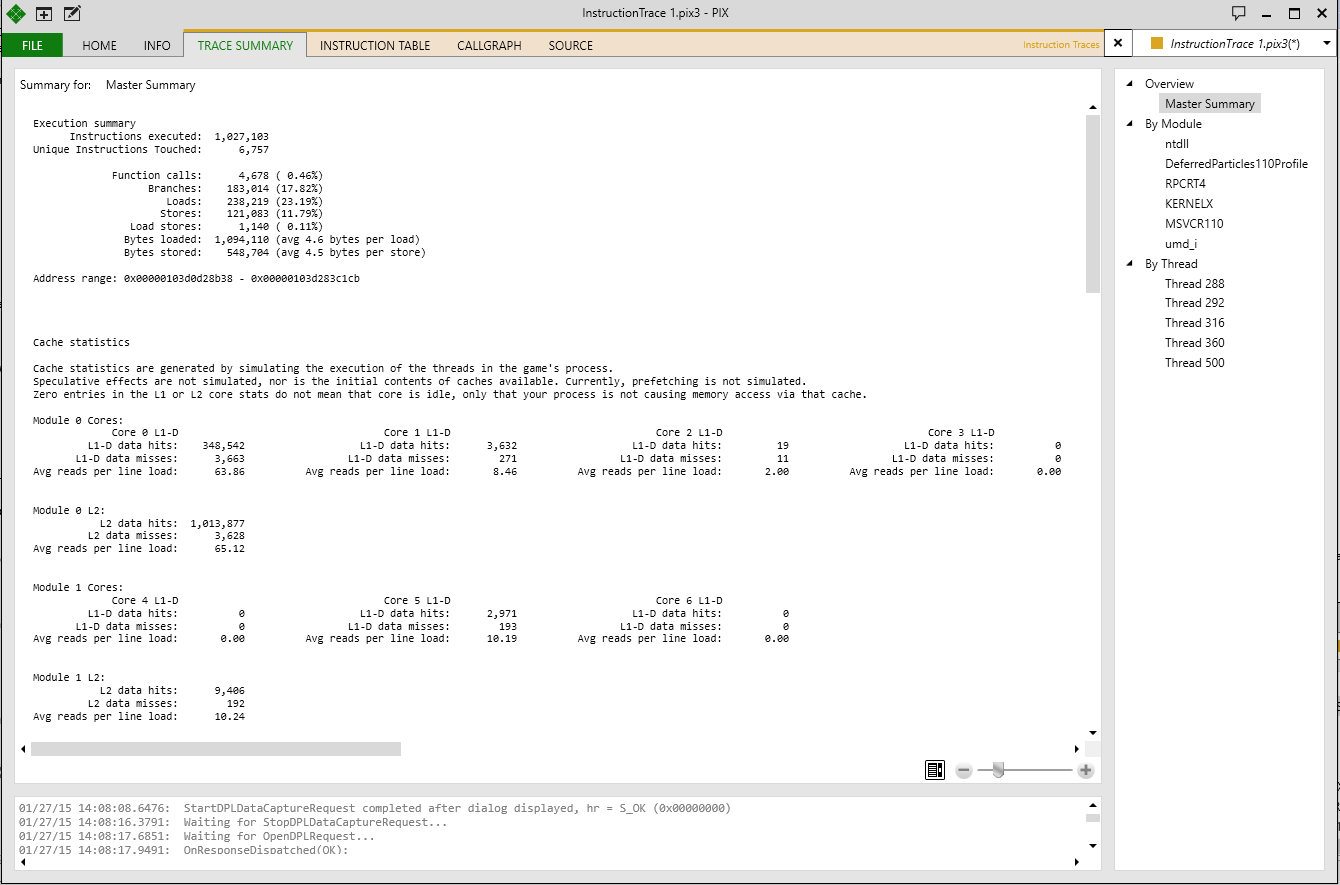 The summary view provides an analysis of how the title is interacting with the memory caches in the system. This analysis includes a listing of the top functions that caused L1 and L2 misses, a listing of the functions that access the most unique cache lines, and data describing how often individual cache lines are loaded, read, and written to.
Figure 3. Cache Line Statistics: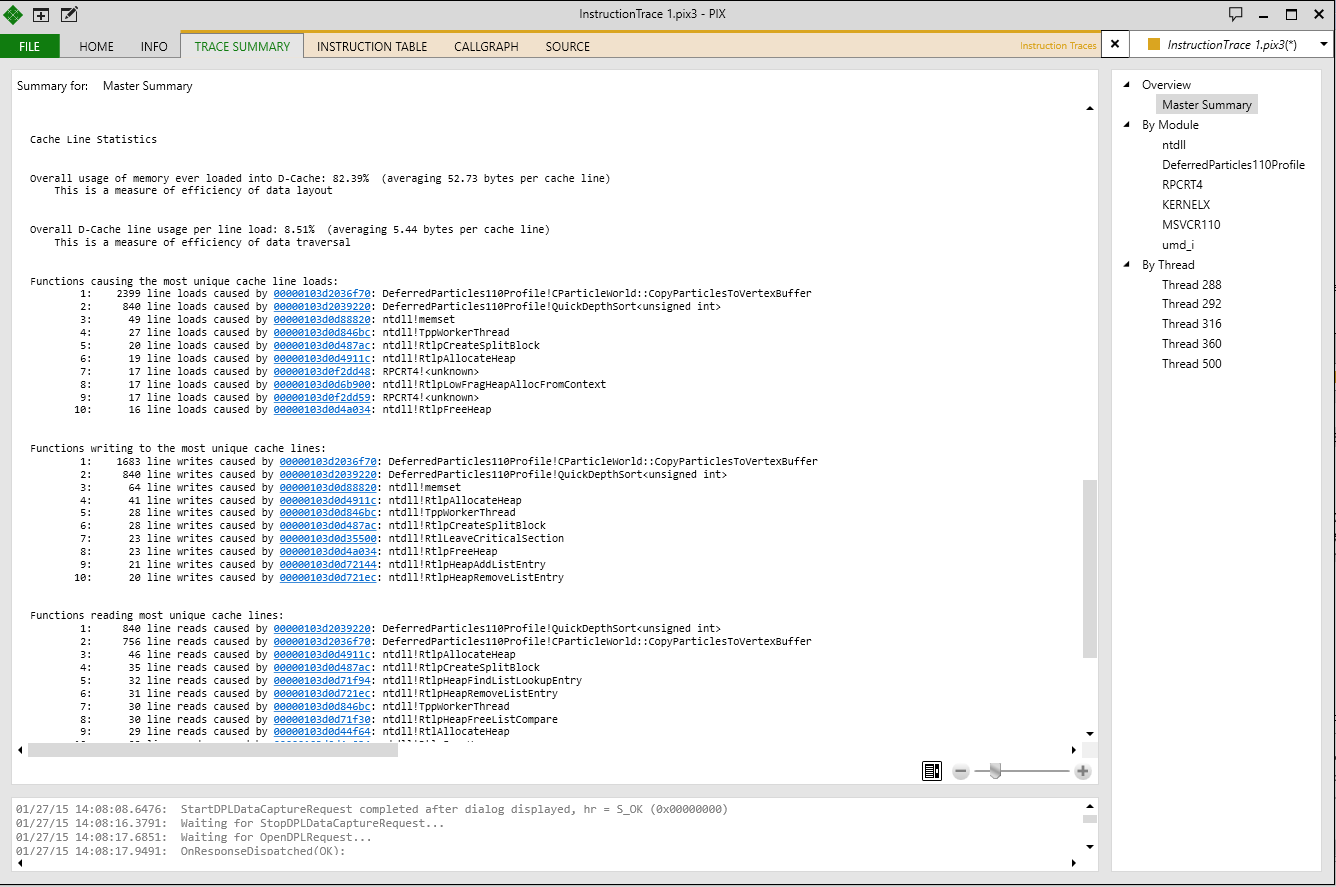
- Use the INSTRUCTION TABLE view to look at specific CPU instructions.
Figure 4. Instruction Trace Table: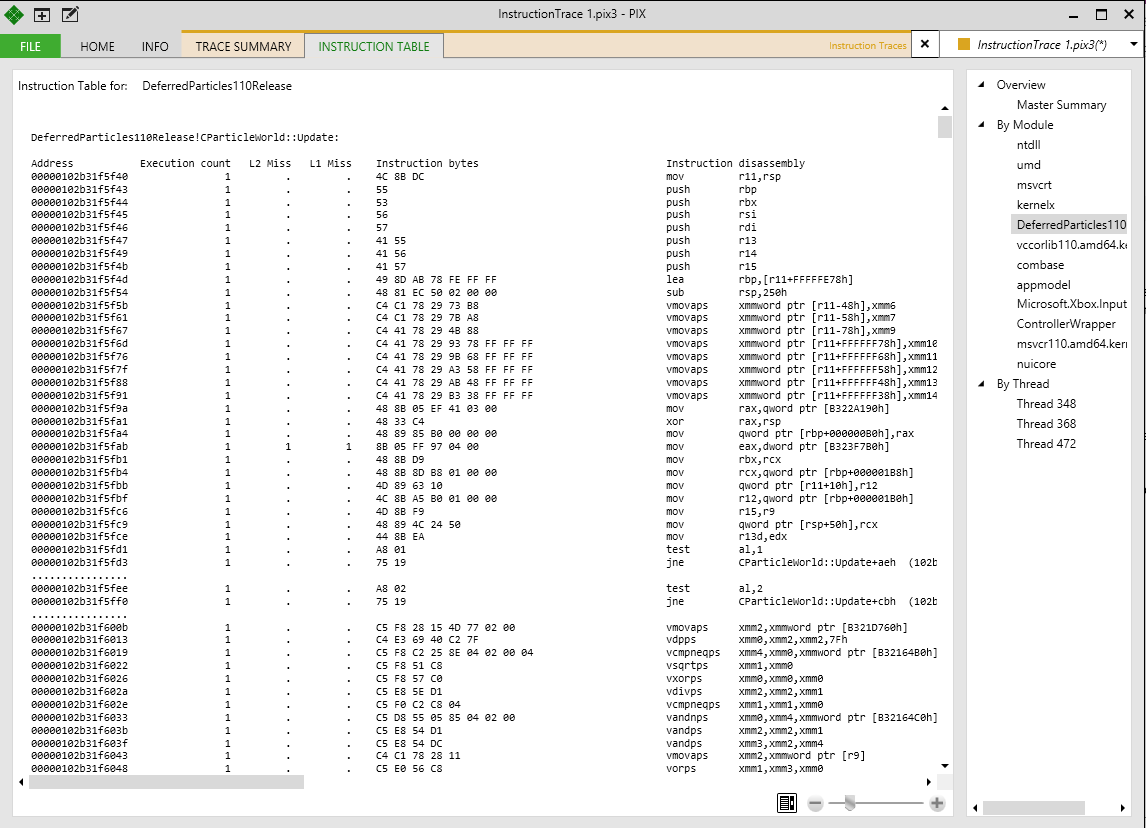
- Instruction traces can also be used to map assembly instructions back to lines of source code.
To view the mappings:
- In the Instruction Table tab, right-click on an instruction, hyperlink, or function name. Then click Goto Source from the context menu.
- Or, in the Trace Summary tab, click a hyperlink.
Figure 5. Instruction Table: the Goto Source context-menu command: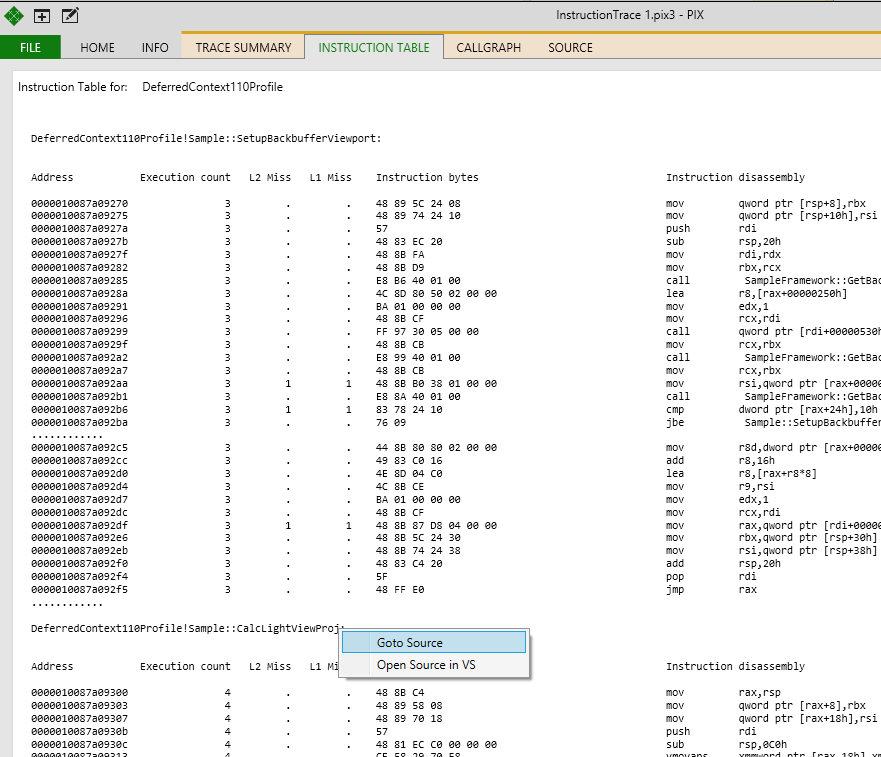
- Goto Source will open the Source tab and display the source code that corresponds to that instruction. The name of the source file is displayed at the top of the view. Currently the source file opened is the one specified in the PDB, including its path.
The Source view has expand/collapse arrows you can use to see, or hide, all assembly instructions associated with a particular line of source code:
Figure 6. Instruction Trace: SOURCE view: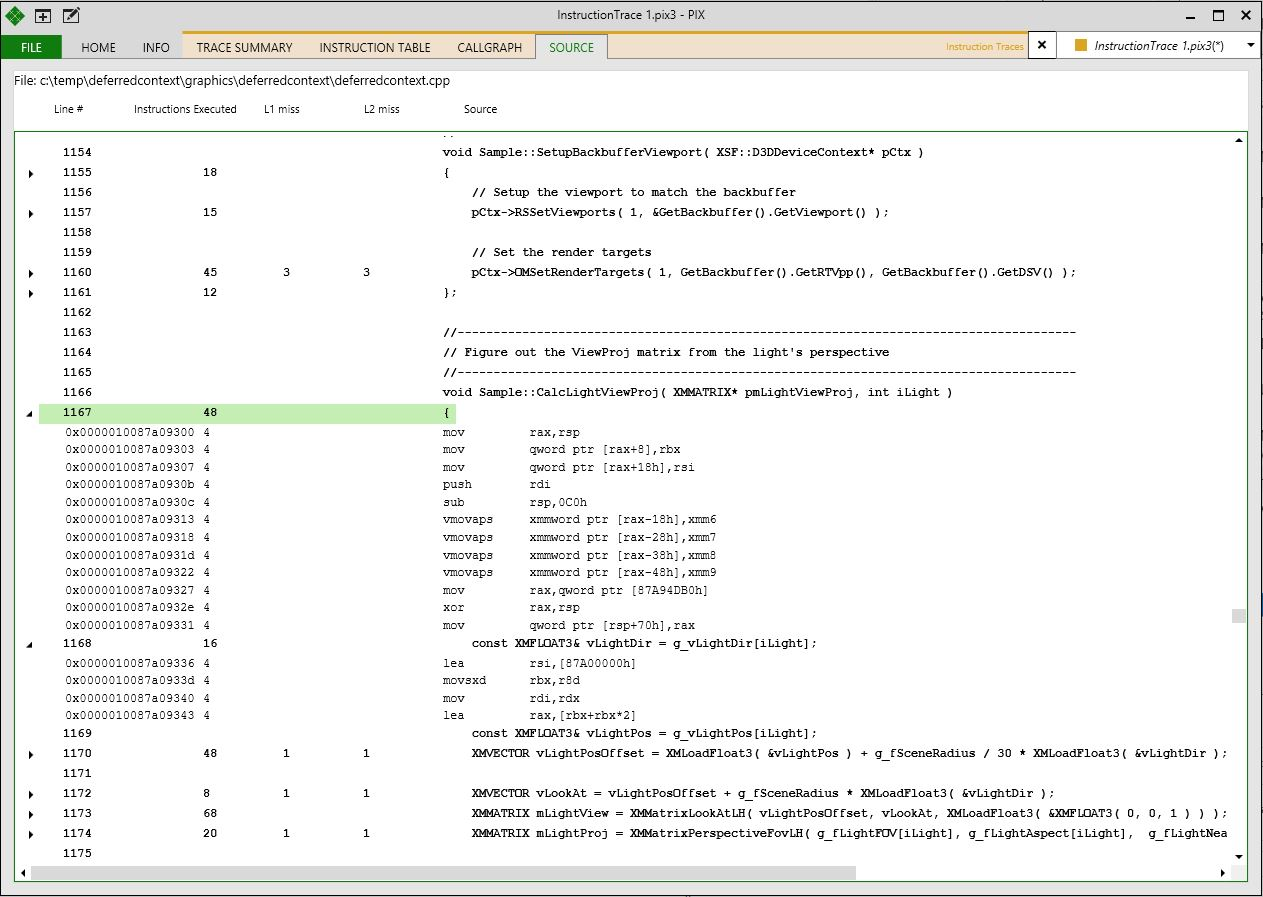
- In the image above, L1 and L2 cache misses are also displayed. Similar to the Instruction Table, these misses come from a simulation of caching behavior.
- The Source view also has a “Find” feature to locate specific text within the source. To open the Find in Source dialog box, press Alt+F.
Figure 7. Instruction Trace: SOURCE view: “Find in Source” dialog box: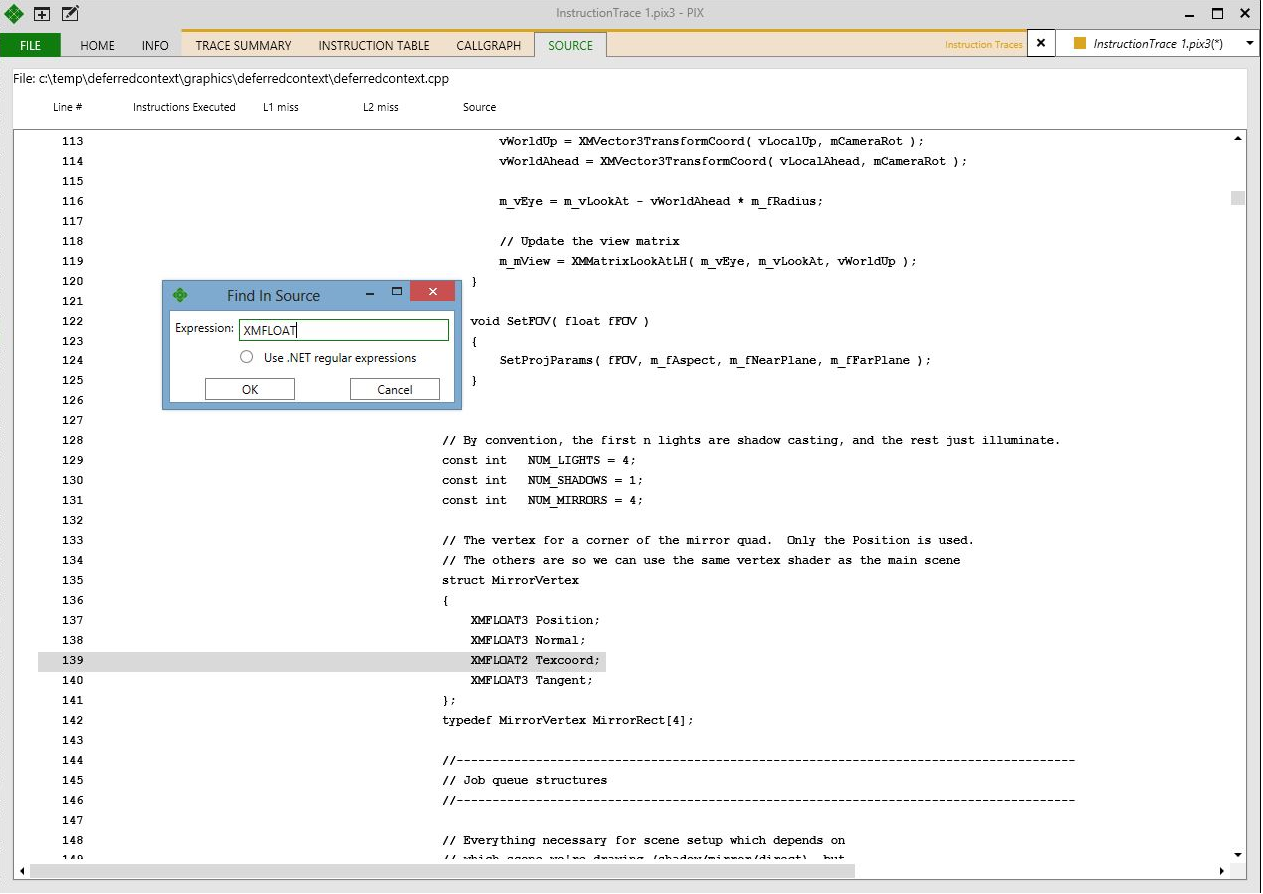 To find the next occurrence of the text, press F3.
 - Instruction traces include a tab that shows the callgraph for functions that ran during the capture. Counters for things like call counts, loads, stores, branches and so on can be added to the view:
Figure 8. Instruction Trace: Callgraph: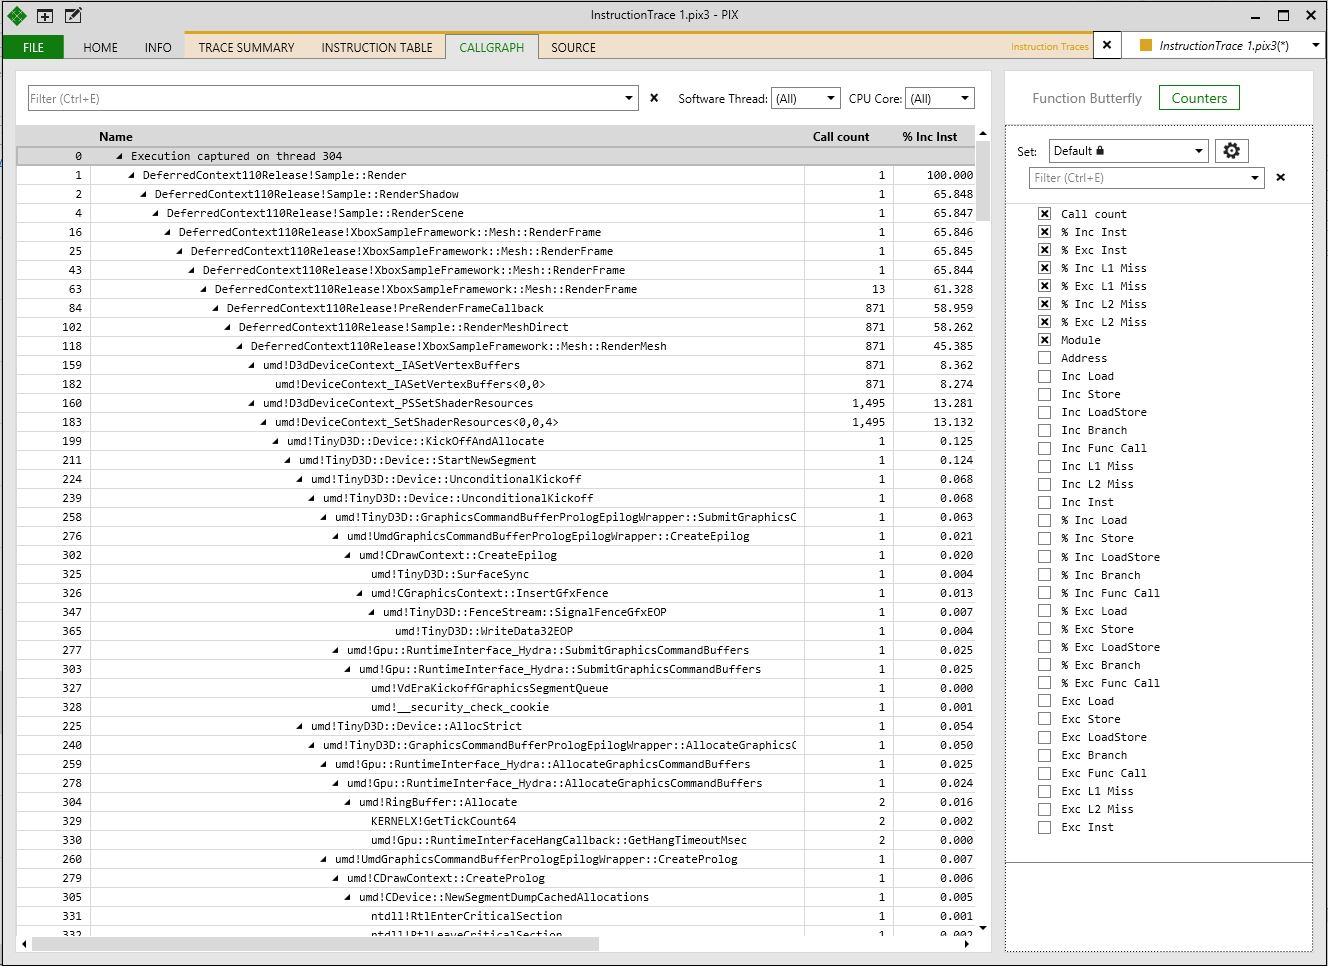 The Callgraph tab in instruction trace captures includes the ability to filter the data to highlight functions in the callgraph that contain loops. Loops are often interesting sections of code to investigate for performance issues. Common issues include unnecessary nesting and inefficient data structure traversal.
Clicking the Loops Only button on the filter bar causes all functions that contain loops to be selected.
Figure 9. Loops Only selected: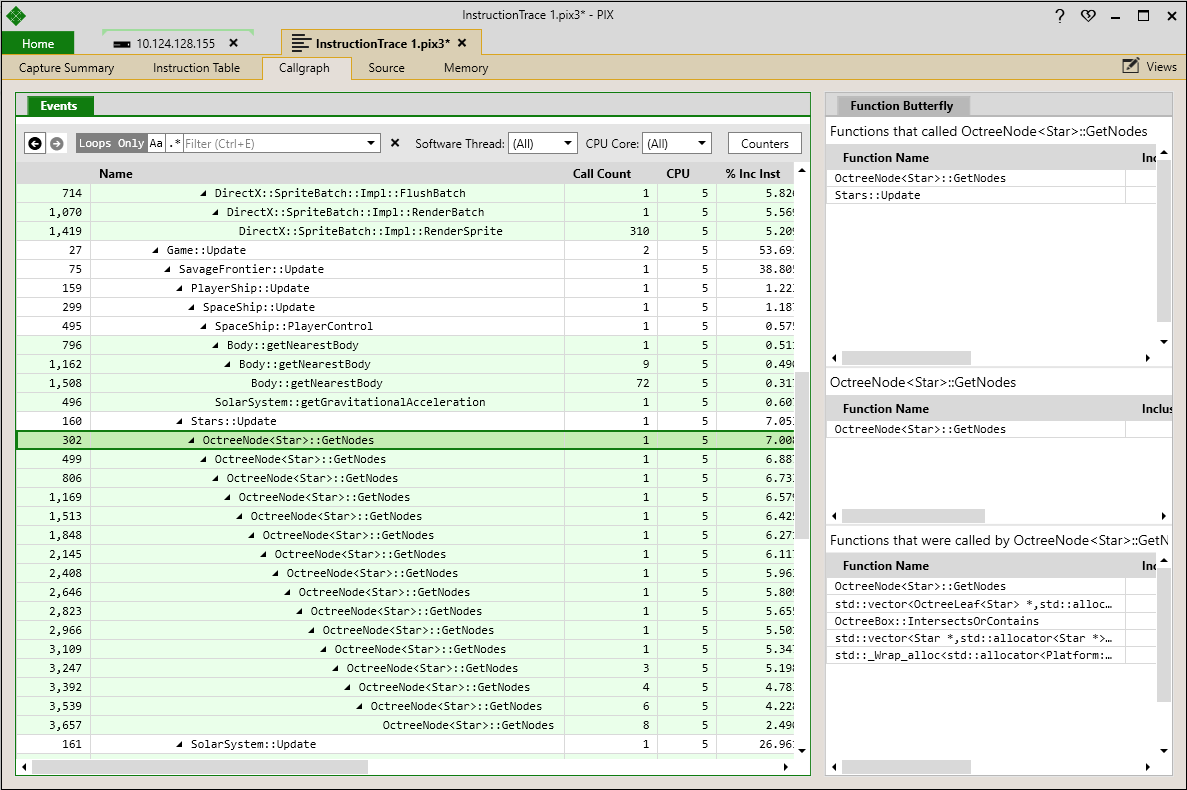 Right clicking on a function with a loop brings up a context menu that contains several options that enable you to explore the function further. Options include viewing a mix of source and assembly code for the function, and the ability to open the memory map scoped to the memory accessed by the function.
Figure 10. Looped function context menu: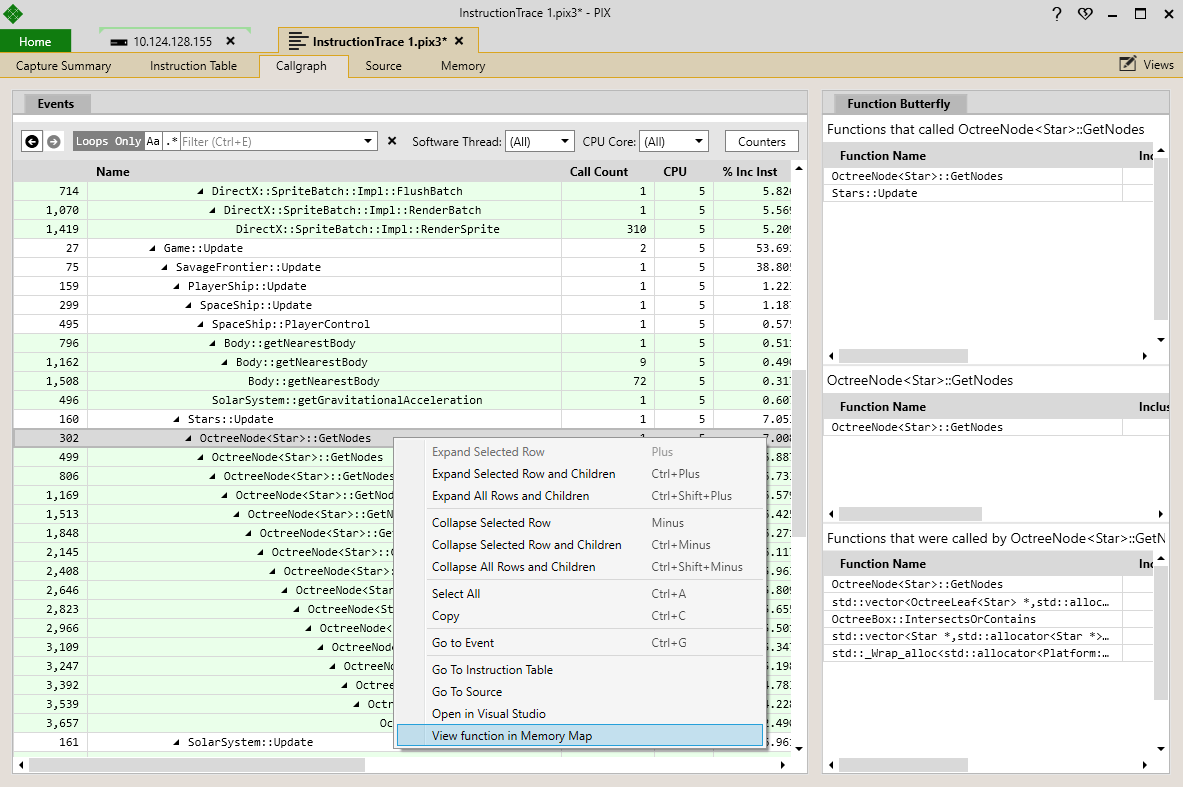
- The function butterfly is also displayed. Refer to The Butterfly View for Function Summary and Callgraph Captures.
Best Practices and Limitations
Instruction tracing shows L1 and L2 data cache misses. These counts show up as additional columns in the instruction table. The cache miss counts are based on a simulation of the caches, not on actual hardware counters or events. Simulation is used because instruction trace incurs additional processing per instruction executed which would distort any real hardware counters. There are, however, a number of issues with the cache simulation:
- Caches are assumed to be cold so initial misses may not be accurate.
- Latency to load lines is not modelled.
- Memory types other than WB (the default – cached memory) are not modelled.
- Hardware prefetchers are not modelled.
- No speculative memory access is modelled, since OOO execution is not fully modelled.
Instruction tracing cannot be used if the title is currently sitting at a breakpoint in the debugger.
White Papers
- No Problem: A Practical Look at PIX
- Xbox One CPU Introduction
- Xbox One CPU: Branch Prediction
- Finding Cache and Branch Issues
- Cross-Core Memory Costs on the Xbox One CPU
- Xbox One - AMD64 Jaguar CPU Instruction Set and ABI Quick Reference Guide