PIX Shader Instruction Trace
Describes how to analyze the shader assembler instructions to determine performance bottlenecks. A good understanding of the Advanced Micro Devices, Inc. Sea Islands instruction set is required.
Shader Cores and Instructions
Shader instruction loads can be measured at a macro-level by GPU counters, but a micro-level picture requires tracing individual waves as they execute one instruction at a time. For instance, GPU counters may show many waves spending time in stalls, yet a trace may reveal that these stalls are entirely hidden by other waves doing useful work.
For detailed information on the VMEM instructions, refer to the white paper How do VMEM Instructions Work
For background information on shader cores, refer to the white paper Xbox One GPU Shader Cores.
Using the Shader Instruction Trace
The shader instuction trace feature is disabled in PIX default views. To enable it navigate to the Settings menu, and select the feature. Also select the Events view, if it is not selected already, as this view is used to scope the output for the shader instruction trace view.
The following images show that a new tab with Shader Instruction Trace and Events:
Figure 1. The left hand side shows the waves, the right the GPU instructions and statistics, the selected draw event below.
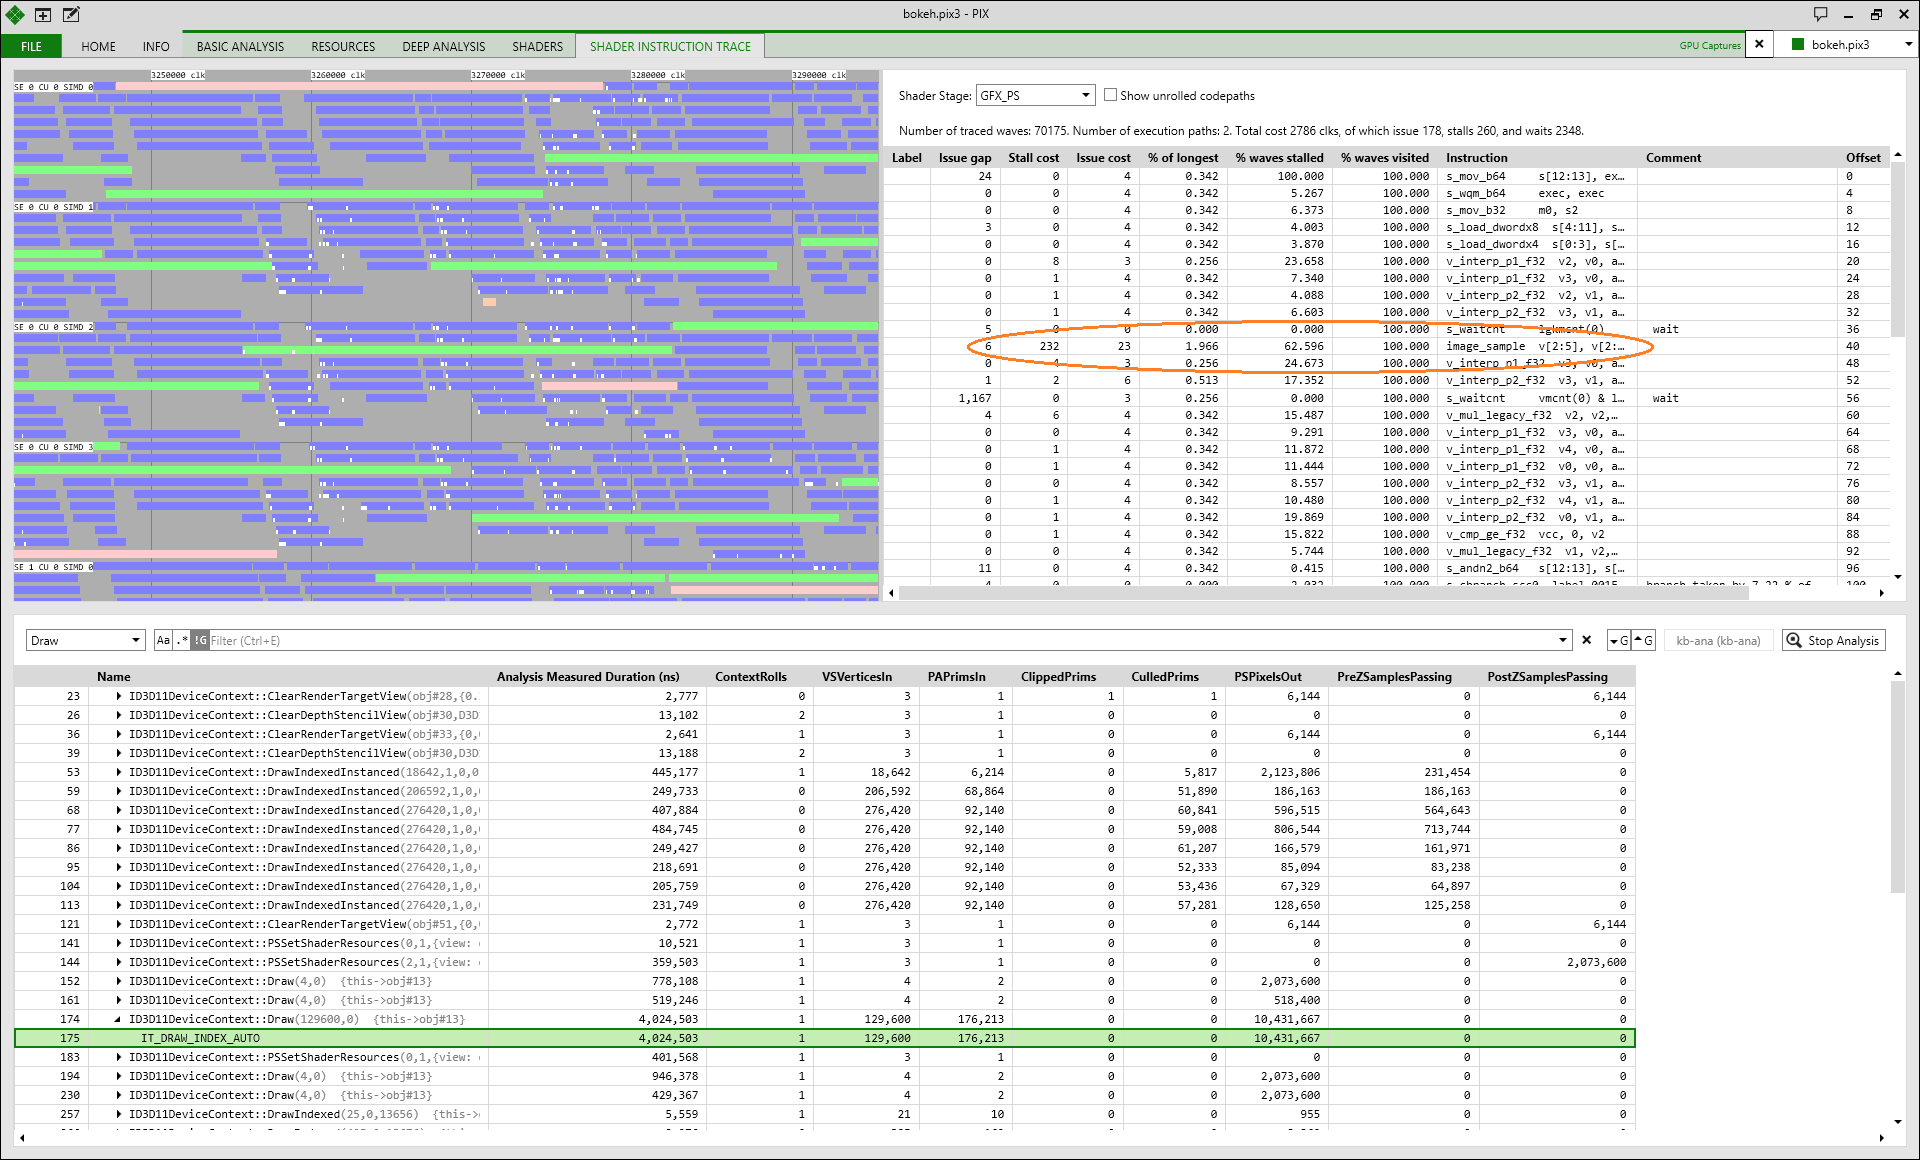
The trace has two parts. On the left side each bar shows a wave. The color of the wave indicates the shader stage (VS = Green, PS = Blue, CS = Teal, GS = Red - refer to the Timeline view for a full color list). The horizontal scale shows time as clock ticks, the vertical scale lists the different Single Instruction Multiple Data units (SIMDs) of each compute unit. Filled bars represent draw calls selected in the Events list, outlined bars represent neighboring draw calls. White hash marks indicate clocks when instructions were issued.
Use the following controls to examine the wave data:
- Pan in the view using a right-click of the mouse, and drag.
- Zoom into the timeline using Ctrl and the mouse wheel.
- Without the Ctrl, the mouse wheel scrolls the view.
When examining the GPU instructions and statistics on the right, look for the most expensive instructions; values above %100 mean that the shader is looping. For all classes of instructions Stall cost is important, for some Issue cost is important. In the example an Issue gap of 1,167 means that the shader wave was idle for this number of clock cycles. This delay could be a performance issue that needs fixed, it could be unavoidable, or it could be hidden by other waves executing.
In the example shown the image_sample instruction (a texture fetch) has a stall and this is where memory latency is seen. The fetch is stalled while getting access to the Texture Addressing (TA), so the s_waitcnt cost is all memory latency.
The Offset column gives the offset is in bytes from the base of the shader. This can be useful in matching binaries back to the trace, or figuring out if stalls coincide with cache line boundaries.
There are some limitations to the shader instruction trace view, the instruction-level trace only works for the compute units CU0/SE0 and CU0/SE1 (due to hardware restrictions). This can mean that some draw calls do not appear in the view if they did not happen to use these CUs.