Finding Loading Issues
Updated October 21, 2015
In this topic:
- Introduction
- Common steps for finding issues
- Common issues encountered
- The PIX File IO Analysis Suite
- Summary
- Appendix A: Access patterns
- Appendix B: Batch file to create traces
Introduction
This paper focuses on how to find the hot spots in title code and does not go into detail about the best practices for file I/O. For more information about best practices, see:
- Less Waiting and More Playing (Conference Material > Xfest 2015 CPU Track Videos) presentation (Xfest 2015)
- Designing Title Package Layouts for Updates: Best Practices and Guidelines white paper
- IO, Storage, and Content Update Best Practices (Conference Material > Xfest 2014 CPU Track Videos) presentation (Xfest 2014)
For the most accurate numbers, use encrypted builds and installed packages when analyzing the performance of file loading issues. Pull deployment and unencrypted builds will have different performance than you would see in retail.
Several WPA profiles are included with the June 2015 XDK and are referenced in this paper.
For a quick overview of the major access patterns used for file loading, along with the pros/cons for each, see Appendix A: Access patterns.
All of the samples used in this paper use FILE_FLAG_NO_BUFFERING and blocking I/O to make the data easier to visualize. However, the steps provided will work with any combination of I/O patterns.
The following code is used to create and read from the files used in this paper:
      // Open File
      <file handle> = CreateFile(<file name>, GENERIC_READ, 0, nullptr, OPEN_EXISTING, FILE_FLAG_NO_BUFFERING, nullptr);

      // Read data
      SetFilePointer (<file handle>,<4K aligned offset>,<high bits 4K aligned offset>,FILE_BEGIN);
      ReadFile (<file handle>,<8 byte aligned buffer>,<4K aligned size>,<pointer for size read>,nullptr);
Common steps for finding issues
The first step to tracking down file loading issues is to use the tracelog command instead of xbperf. This allows the location of the profile data to be stored on a USB drive and greater flexibility in choosing the data collected.
- For a batch file that automatically handles tracelog for file captures, see Appendix B: Batch file to create traces.
-
To start the capture as soon as the title starts up, append xbconnect /wt to the start of the batch file and run the batch command before starting the title.
-
The included batch file will automatically open the ETL file in WPA if WPA is in your path.
-
- Load the symbols by using the trace menu in WPA.
- Make sure the Symbol path is configured correctly through the trace menu:
- The default path comes from the _NT_SYMBOL_PATH environment variable.
- WPA will process the pdb files and store a cache for faster lookup in the SymCache path. Use the _NT_SYMCACHE_PATH environment variable to override the default.
- In some cases, WPA may appear to hang when loading symbols; there are several causes:
- It needs to build a cache for each pdb file. For larger pdb files, this can take several minutes. However it only needs to do this the first time a particular pdb is seen.
- Using an older version of WPA. The version included in the Windows 10 SDK is the most recent: version 10.0.10240.16384.
- Make sure the Symbol path is configured correctly through the trace menu:
Common issues encountered
In this section:
- Locating reads
- Expensive reads
- Low/Spiky throughput
- Random access
- Redundant reads
- Backwards reads
- Determining I/O vs CPU bound
Locating reads
Correlating the location in code to an actual request to the disk for data and a point in time can be a difficult task. There are usually many factors that affect the overall read order of data. For example, the order of loading textures could change depending on the level being loaded.
To locate reads:
- Perform the common steps discussed earlier in this paper to generate an ETL file.
- Use the FileAccess profile included with this white paper or provided by PIX <XDK install dir>\bin\wpa\profiles> (see Figure 1).
Figure 1. Default view provided by the FileAccess profile; provides a timeline of file access by path name.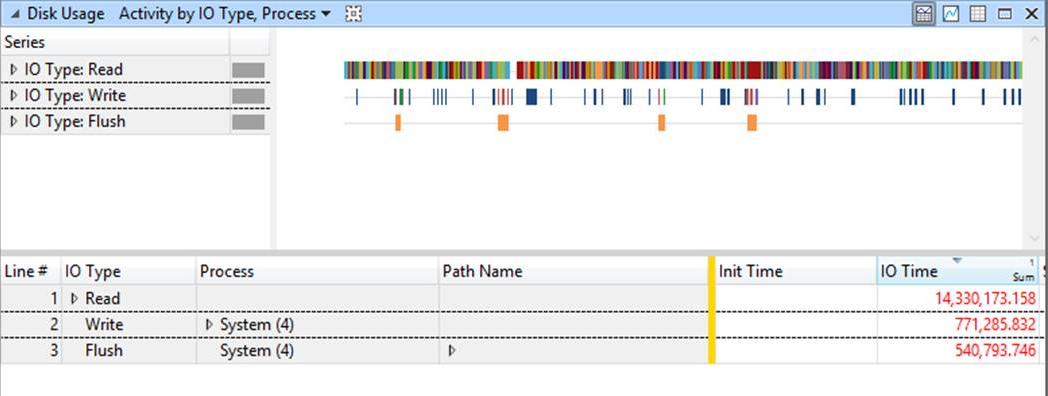 1. Depending on the title architecture, the I/O Init Stack (Frame Tags) column may be useful. This can add a lot of noise to the display and has been left off by default. However, the included batch file will capture the data.
 - The graph (see Figure 2) will show over time the locations being read, broken down by file.
Figure 2. Expanded Disk Usage showing reads from each file over time in the Graph window.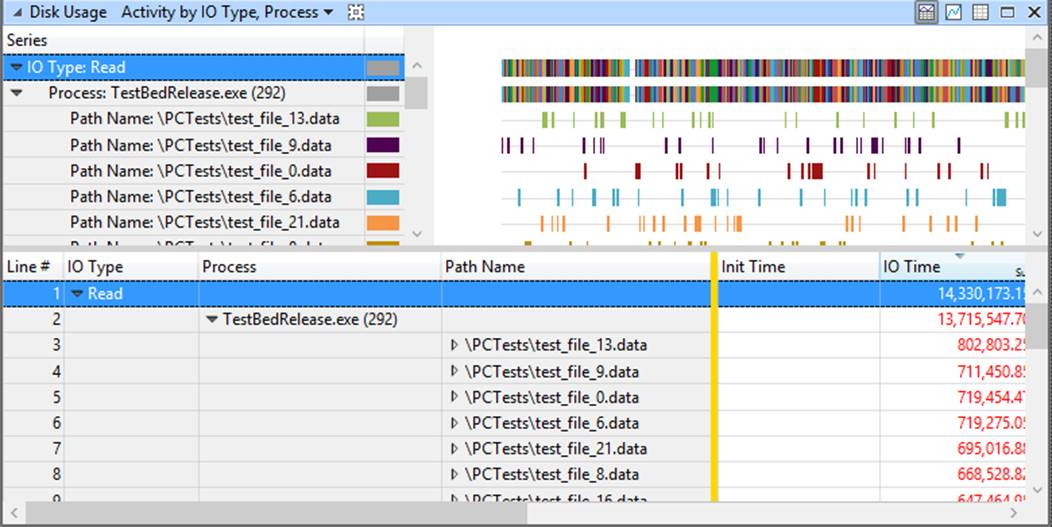 1. Use the Find command on either the call stack or the path name in the Data Table to automatically select all reads that match. The corresponding areas in the graph will be highlighted (see Figure 3).
Figure 3. Using the Find command to locate all reads from a specific file, in this case “test_file_10.data.”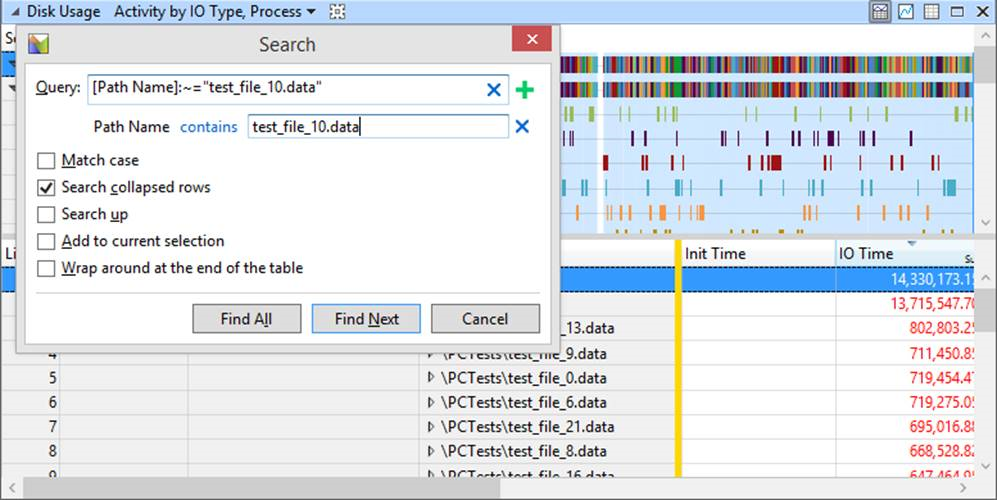 1. In general, the reads per file should be grouped together over time. The Xbox One console will keep Individual packages contiguous on the hard drive.
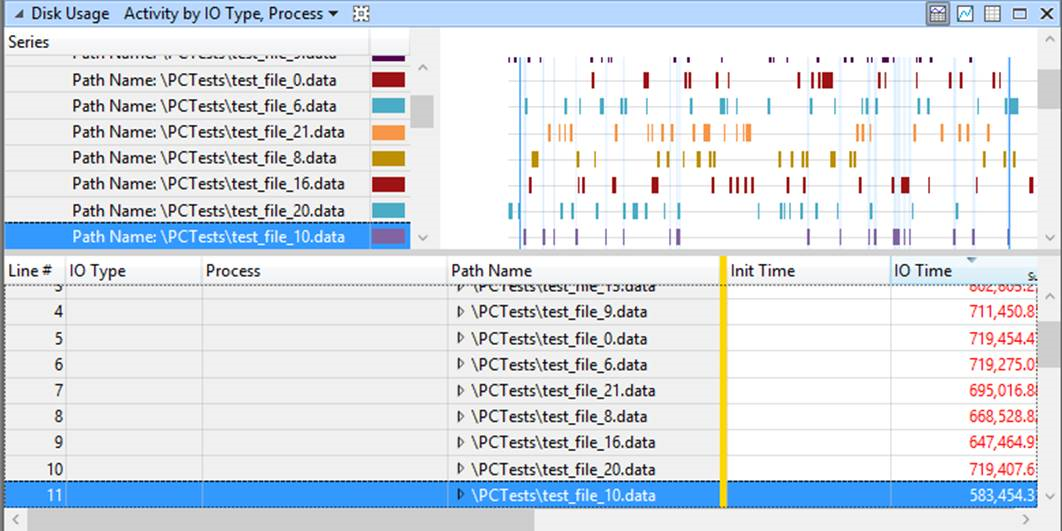
- If the reads aren’t grouped together, the title is probably performing a large number of seeks.
- Figure 4 shows a very poor grouping of reads per file.
Figure 4. Selection of “test_file_10.data” in Data Table. All matching points in time highlighted in the Graph window.
 1. Overlapped I/O should have the average QD/I as high as possible; if the number is low, there is not enough data for the OS to reorder correctly. The QD/I column will be zero for titles that use blocking I/O.
Expensive reads
In some cases, there may be reads going on in the title that are dominating the overall loading time. Without extensive hooks added to the title code, the expensive reads can be hard to track down without WPA.
To locate expensive reads:
- Perform the common steps to generate an ETL file.
- Use the FileExpensive profile included with this white paper or provided by PIX <XDK install dir>\bin\wpa\profiles> (see Figure 5).
Figure 5. Default view provided by the FileExpensive profile; shows activity over time by each process.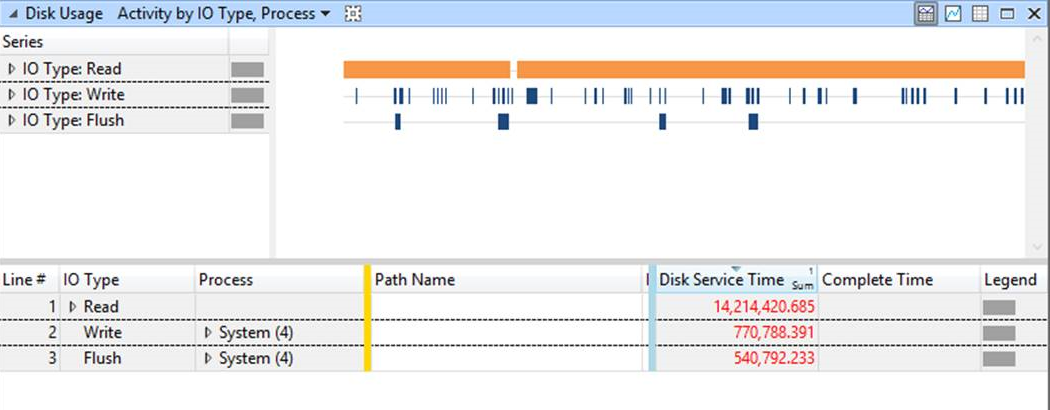 1. Depending on the title architecture, the I/O Init Stack (Frame Tags) column may be useful. This can add a lot of noise to the display and has been left off by default. However, the included batch file will capture the data.
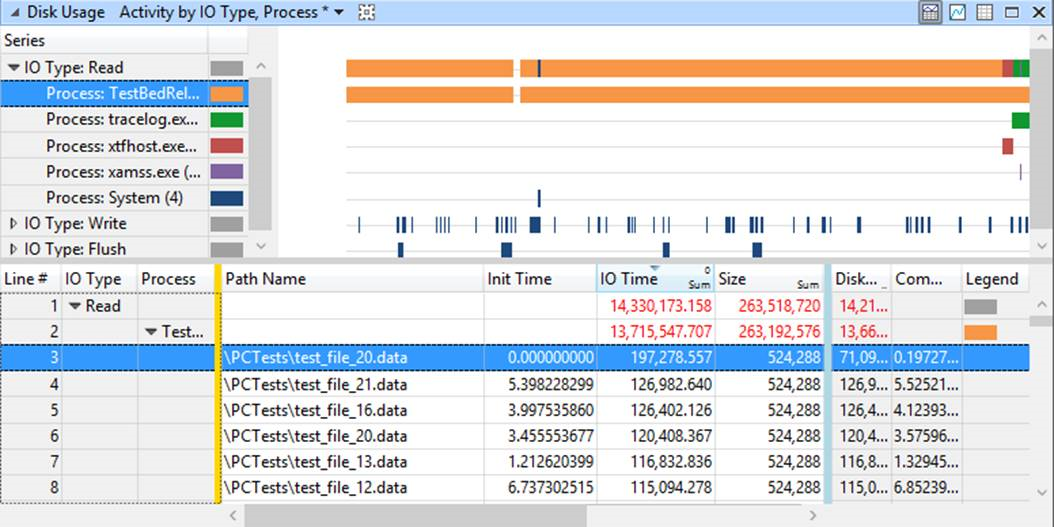
 - The provided profile in Figure 6 is set up to sort by I/O Time and Disk Service Time in descending order. The most expensive reads will show up at the top. The difference in the two times is the seek time. Compare those to the size of the read to determine if the time is expected.
Note In Figure 6, the first entry selected has an Init Time of 0. In most cases this means the read was started before the capture was started. This read should be ignored.
Figure 6. Expanded activity showing all individual read requests sorted by IO Time, the total time to process the request.
Common causes
Blocking reads
Long seek times. For details on locating those, see random access.
Overlapped reads
Low number in the QD/I column. There is not enough data for the OS to reorder the requests efficiently.
Low/Spiky throughput
The Xbox One documentation guarantees at least 40 MB/s over any two-second period. If the title is seeing throughput below this number at times, it needs to track down where it is coming from. The steps are similar to finding expensive reads; however, this is a different way to visualize the same data.
To locate poor throughput:
- Perform the common steps to generate an ETL file.
- Use the FileThroughput profile included with this white paper or provided by PIX <XDK install dir>\bin\wpa\profiles> (see Figure 7).
- Two windows are presented: Throughput over time and Disk Utilization over time.
Figure 7. Default view provided by the FileThroughput profile; compares average throughput to disk utilization.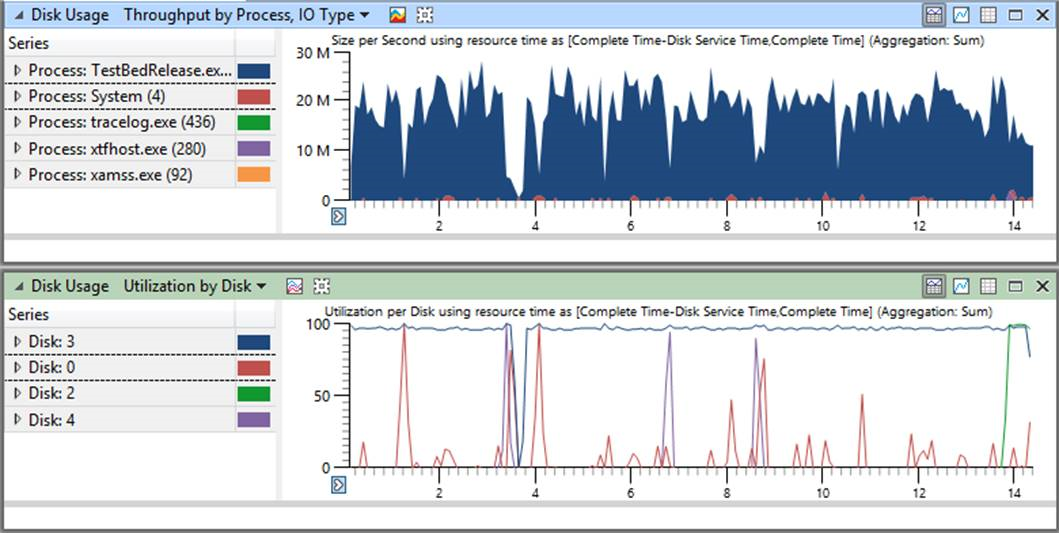 1. Depending on the title architecture, the I/O Init Stack (Frame Tags) column may be useful. This can add a lot of noise to the display and has been left off by default. However, the included batch file will capture the data.
 - The provided profile in Figure 8 is set up to sort by I/O Time in the Data Table in descending order. The most expensive reads will show up at the top. Compare those to the size of the read to determine if the time is expected.
Figure 8. Default throughput view sorted by IO Time, the total time to process a request.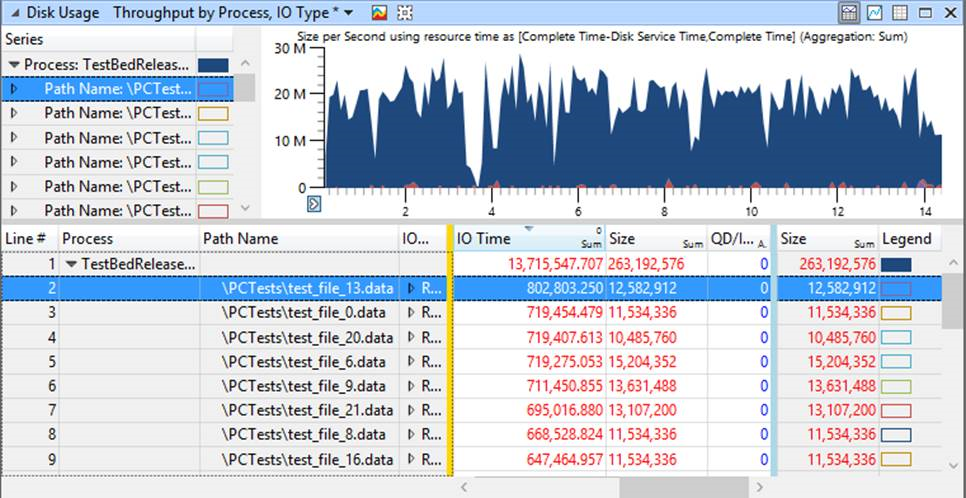 1. The throughput graph in Figure 9 shows the amount of data being read per second through a sliding one-second window based on the current visible section.
 - Look for areas with noticeable dips in throughput with high disk utilization.
Figure 9. Area of time selected when overall disk throughput is low.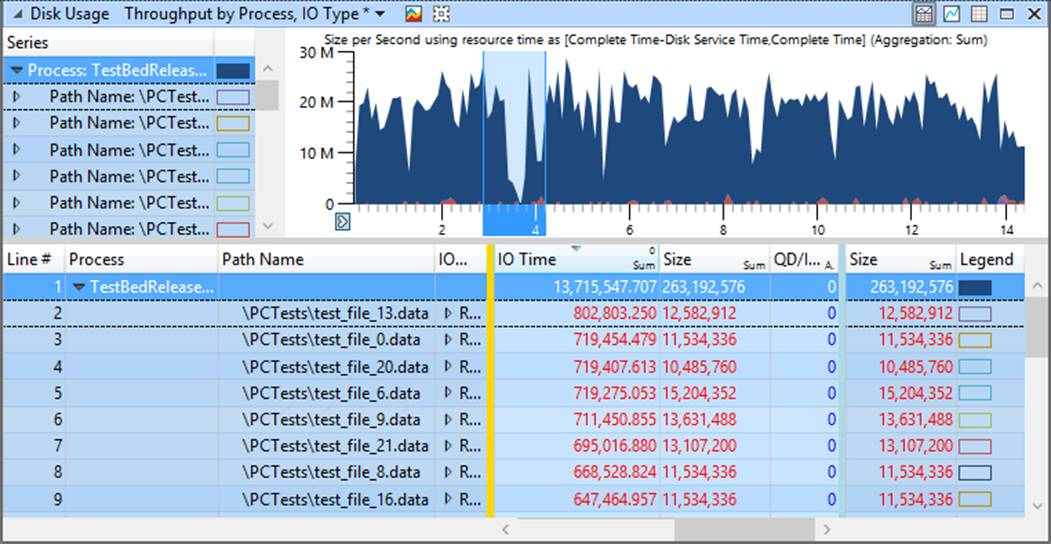 1. Zoom in to those areas (in Figure 10) to reduce the noise from other reads in the Data Table.
Figure 10. Zoomed-in section of low throughput giving more details on just that location.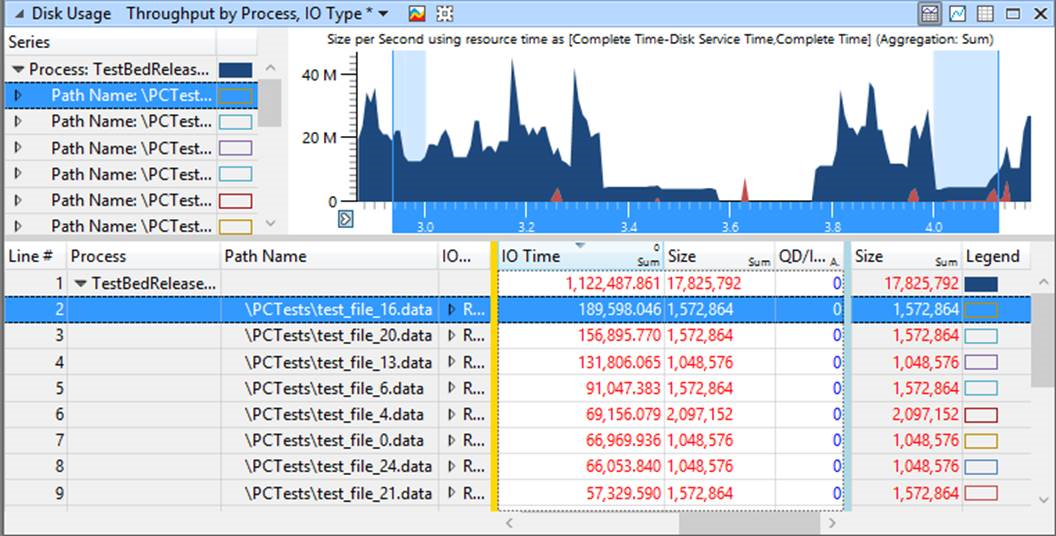 1. Check the highest I/O Time reads for the cause of the low throughput. The I/O Init Stack (Frame Tags) column will have matching call stacks. If the matching time in the Disk Usage Utilization by Disk window is high, there is probably a seek issue.
 - If the Disk Usage Utilization by Disk window is also low, the title is probably not requesting data fast enough.
Common causes
Blocking reads
Long seek times. For details on locating those, see random access.
Overlapped reads
Low number in the QD/I column. There is not enough data for the OS to reorder the requests efficiently.
Other access from the OS that is taking away bandwidth at that particular point
Look for disk usage by System and see if it coincides.
Random access
The main cause of performance problems comes from random access to locations on the disk. This causes the disk head to seek a new location on each read, which can take a considerable amount of time between reads.
To locate random access patterns:
- Perform the common steps to generate an ETL file.
- Use the FileLayout profile included with this white paper or provided by PIX <XDK install dir>\bin\wpa\profiles>.
- The graph in Figure 11 shows the physical location of reads from the disk over time.
Figure 11. Default view provided by the FileLayout profile; shows location on the physical disk for each read request over time.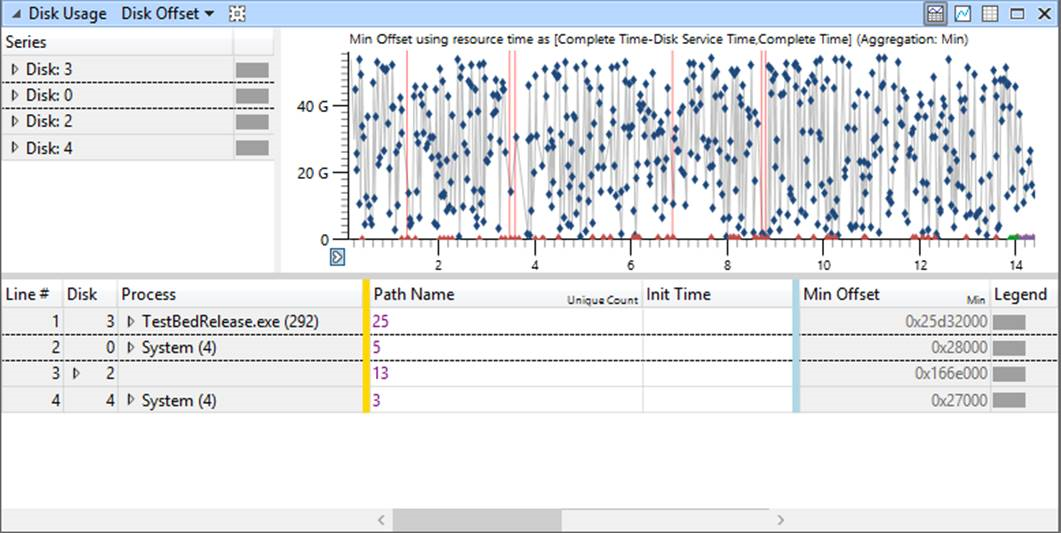 1. Depending on the title architecture, the I/O Init Stack (Frame Tags) column may be useful. This can add a lot of noise to the display and has been left off by default. However, the included batch file will capture the data.
 - Look for blocks of similar locations grouped together in time. If there are few similar locations grouped together, the title is losing performance from disk seeks (see Figure 12).
Figure 12. Area of time with some similar read locations. Notice events slightly above the halfway point.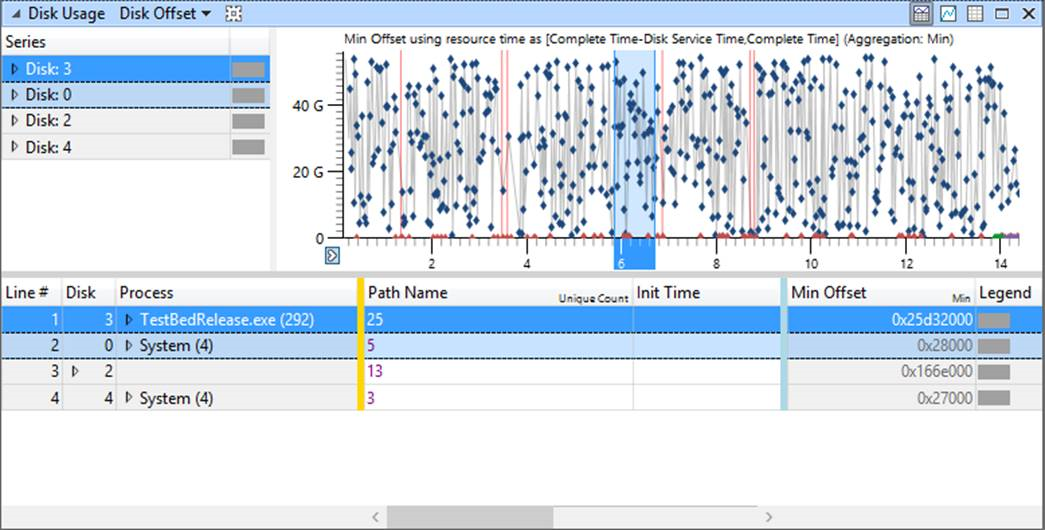 1. Look for areas with large jumps between reads and the location on the disk (see Figure 13).
Figure 13. Area of time selected showing wildly scattered read locations on the disk.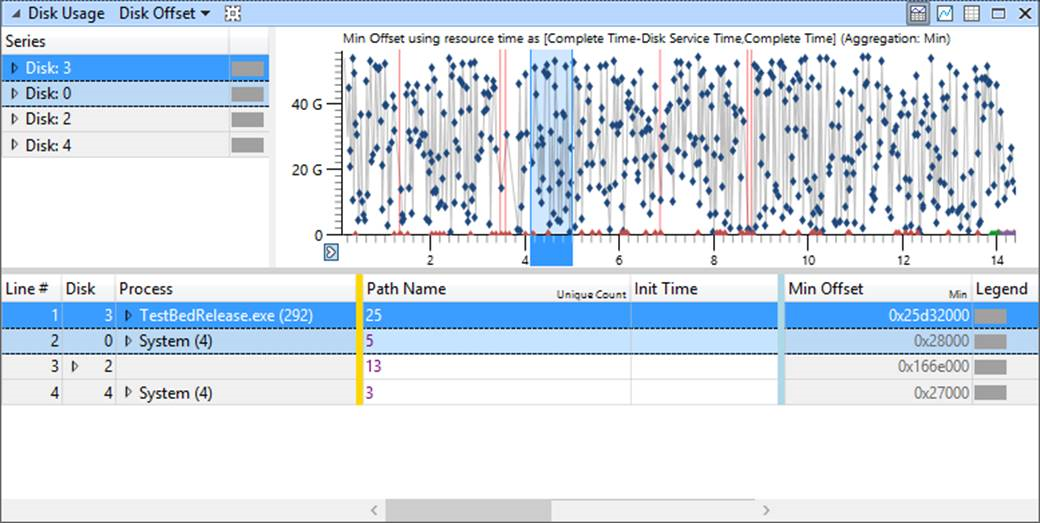 1. Zoom in to those areas to reduce the noise in the Data Table from other reads (see Figure 14).
Figure 14. Zoomed-in area with wildly scattered reads. Notice large amount of time between each read.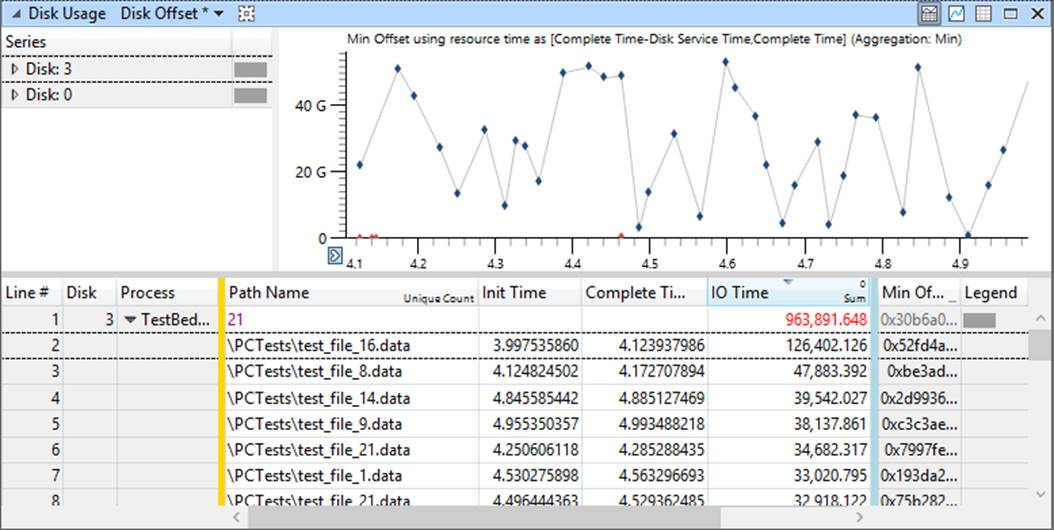 1. Selecting different reads in the Data Table will highlight the corresponding section of the graph. Any non-selected areas between events represent time when no requests have been received from the title.
 - Notice in Figure 15 that the selection covers the time between each event exactly. This means the read request started as soon as the previous request finished. If a sub-area between the event markers was selected, that would represent time when no read was happening.
Figure 15. One read request selected in Data Table and matching point in time selected in Graph.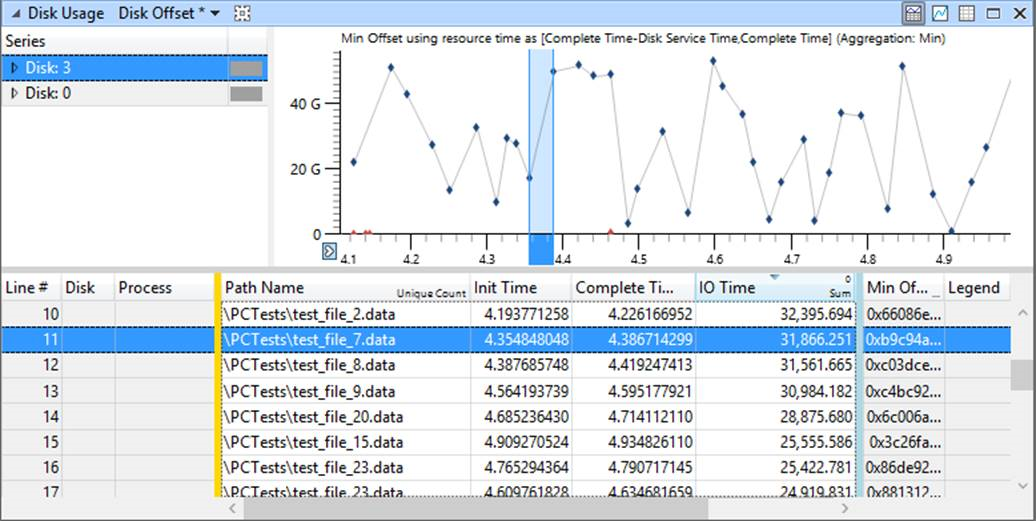
Common causes
Not requesting data fast enough
Large gaps between read request completion and the next read request. See the I/O bound vs CPU bound section.
Seeks taking too long
Large delta in location on disk between read requests.
Redundant reads
Reading the same location in a file multiple times is usually just wasted time that could be better spent reading new data.
To locate redundant reads:
- Perform the common steps to generate an ETL file.
- Use the FileRedundant profile included with this white paper or provided by PIX <XDK install dir>\bin\wpa\profiles> (see Figure 16).
Figure 16. Default view provided by the FileRedundant profile. Notice only Min Offset and Max Offset used the Data Table.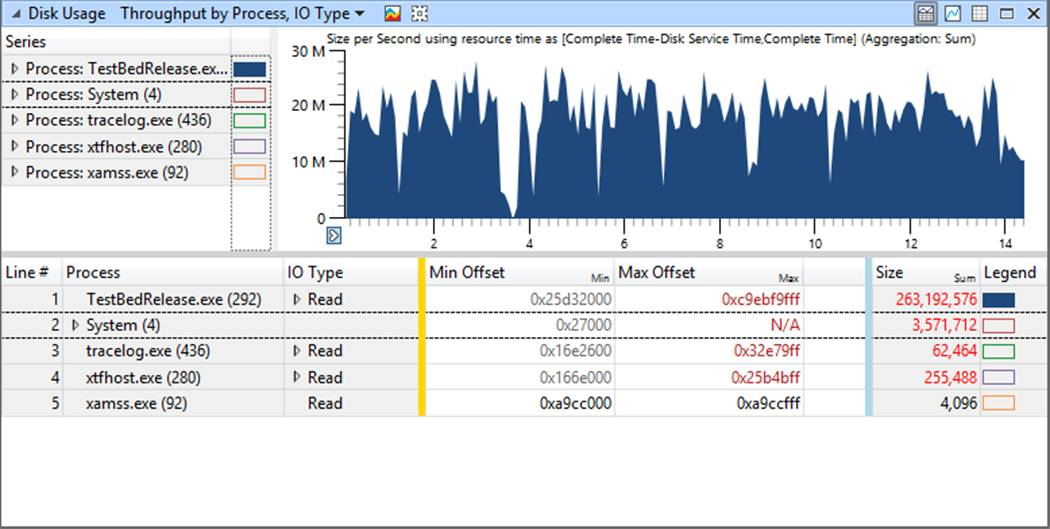 1. Depending on the title architecture, the I/O Init Stack (Frame Tags) column may be useful. This can add a lot of noise to the display and has been left off by default. However, the included batch file will capture the data.
 - In the Data Table, expand the reads from the title.
- Select all of the reads from the title.
- Copy the selection from the Data Table. Make sure you use the copy selection command.
Note If the Min/Max Offset columns are not showing decimals, open the view editor in WPA to switch them in the Column Details pane.
Figure 17. Only the reads from the process are selected. Notice the process itself is not selected in the Data Table.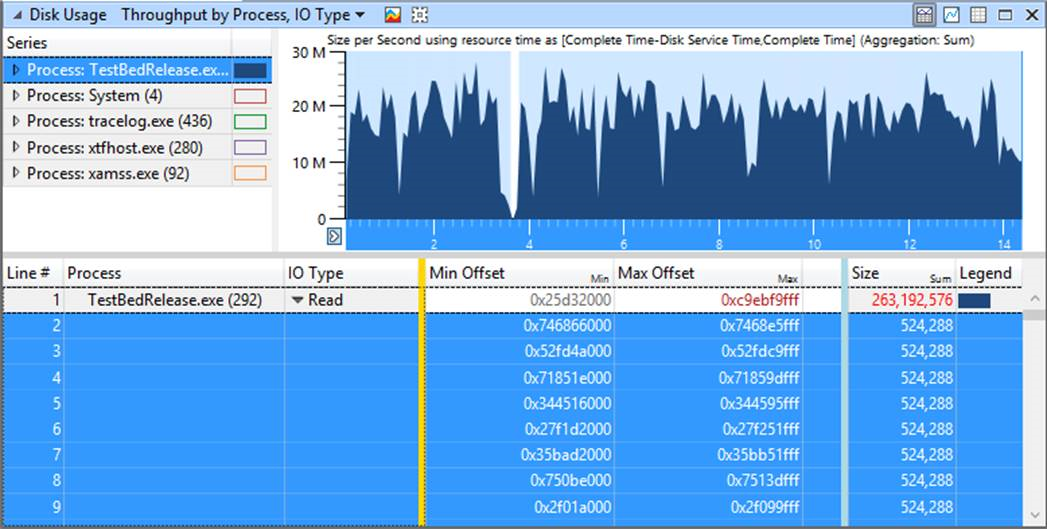 1. Paste into a new Excel workbook and create a table from the data.
 - Sort the spreadsheet by the Min Offset column in decimal from smallest to largest.
- Add a column for overlap detection, and name it “Redundant.” Use this formula to detect redundant reads (the placeholder sections should be replaced with the decimal value cell for the corresponding data):
=NOT(OR(<Min Offset next read> > <Max offset this read>,<Min offset this read> > <Max offset next read>))- All values that have TRUE in the Redundant column are reading data that has already been read.
- Do not sort by the Redundant column. This will give incorrect results due to the detection formula.
Figure 18. All of the data pasted into an Excel table and sorted by Min Offset.
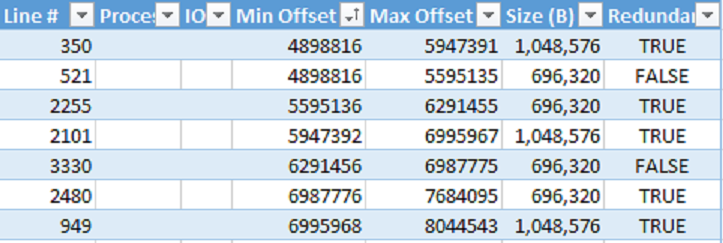 1. The Line # column is a unique number per read; this should be the first column in Excel. Use that number in the Data Table in WPA to find the specific read in question that is redundant.
 - All values that have TRUE in the Redundant column are reading data that has already been read.
For information about how to use PIX to find redundant reads, see file usage list later in this paper.
Backwards reads
We recommend reading data sequentially to achieve maximum performance. One likely culprit of slow I/O performance is reading in reverse order on the disk. This will usually happen with random access patterns.
To locate reverse reads:
- Perform the common steps to generate an ETL file.
- Use the FileReadOrder profile included with this white paper or provided by PIX <XDK install dir>\bin\wpa\profiles> (see Figure 19).
Figure 19. Default view provided by the FileReadOrder profile. Notice only Min Offset and Max Offset used the Data Table.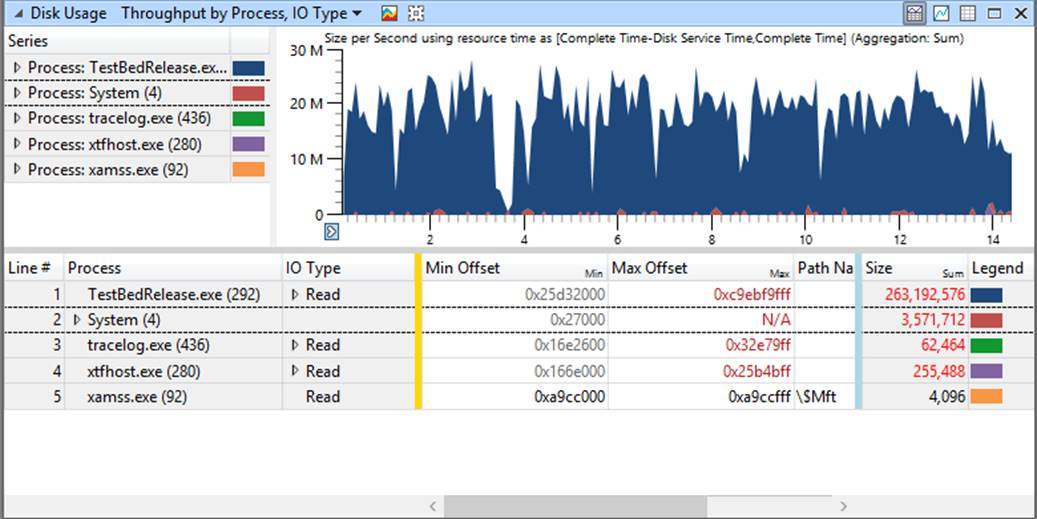 1. The updated WPA profiles attached have the Init Time (s) data column added. The data is sorted in ascending order based on Init Time (s).
 - Depending on the title architecture, the I/O Init Stack (Frame Tags) column may be useful. This can add a lot of noise to the display and has been left off by default. However, the included batch file will capture the data.
- In the Data Table, expand the reads from the title.
- Select all of the reads from the title.
- Copy the selection from the Data Table. Make sure you use the copy selection command (see Figure 20).
Note If the Min/Max Offset columns are not showing decimals, open the view editor in WPA to switch them in the Column Details pane.
Figure 20. Only the reads from the process selected. Notice the process itself is not selected in the Data Table.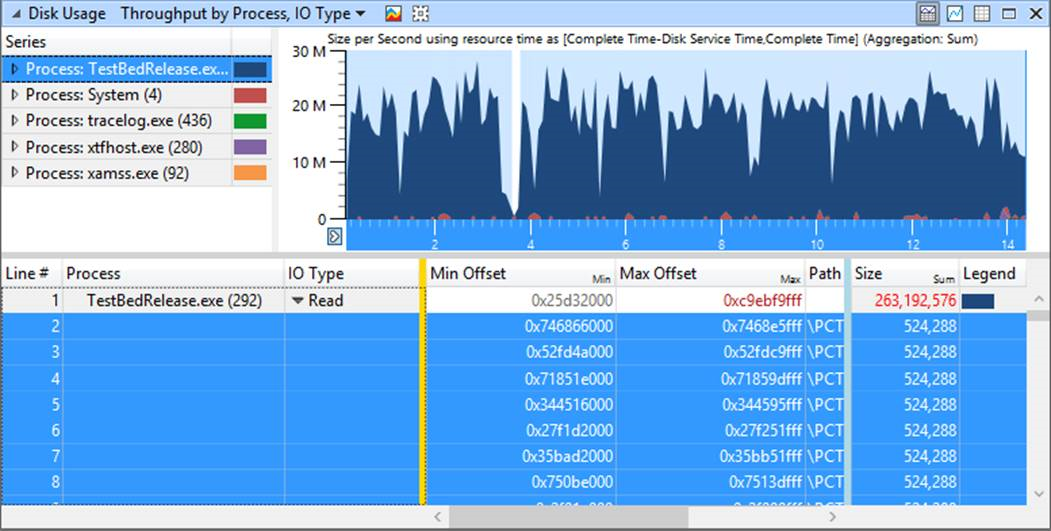 1. Paste into a new Excel workbook and create a table from the data.
 - Add a column for backwards read detection, and name it “Reverse.” Use this formula (the placeholder sections should be replaced with the decimal value cell of the corresponding data):
=(<Min Offset next read> < <Min Offset current read>)- All values that have TRUE in the Reverse column are a backwards read from the previous read (see Figure 21).
- Do not sort by the Reverse column. This will give incorrect results due to the detection formula used.
Figure 21. All of the data pasted into an Excel table with the Reverse column added.
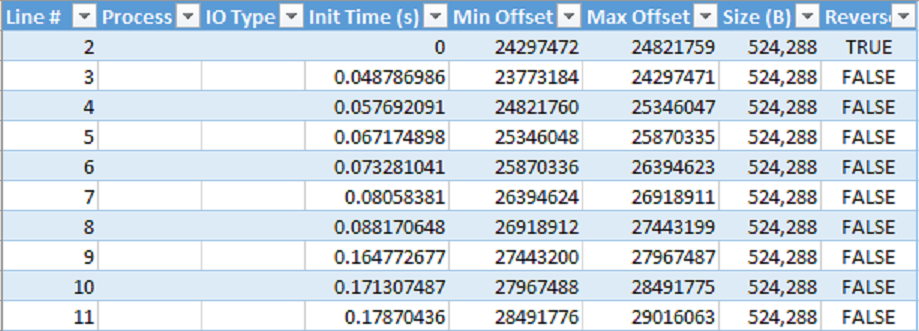 1. TheLine # column is a unique number per read; this should be the first column in Excel. Use that number in the Data Table in WPA to find the specific read in question that is a backwards read.
 - All values that have TRUE in the Reverse column are a backwards read from the previous read (see Figure 21).
Determining I/O vs CPU bound
The final piece of the loading puzzle is to determine if the title is bound by File I/O time or by CPU time. If the title is CPU bound, there is no need to look at making the read requests sequential, for example. Adjusting the read order will not help the overall performance.
To determine if the title is I/O or CPU bound:
- Perform the common steps to generate an ETL file.
- Use the FileBound profile included with this white paper or provided by PIX <XDK install dir>\bin\wpa\profiles>.
- This profile is a combination of the FileThroughput, FileAccess, and CPU performance profiles. This makes it easier to compare CPU usage against disk usage.
- With blocking I/O there is always a context switch when requesting data from the disk. Context switches drive the precise CPU utilization window. Compare disk throughput to CPU utilization to determine the controlling piece of low throughput.
- If the title has high CPU utilization, the title is CPU bound.
- If the title has poor or spiky throughput, the title is I/O bound.
- Look for areas with poor throughput in the Disk Usage Throughput by Process, IO Type window. The Low/Spiky Throughput section has details on this (see Figure 22).
Figure 22. Comparing CPU Usage against Disk Usage. In this case both windows are showing low usage.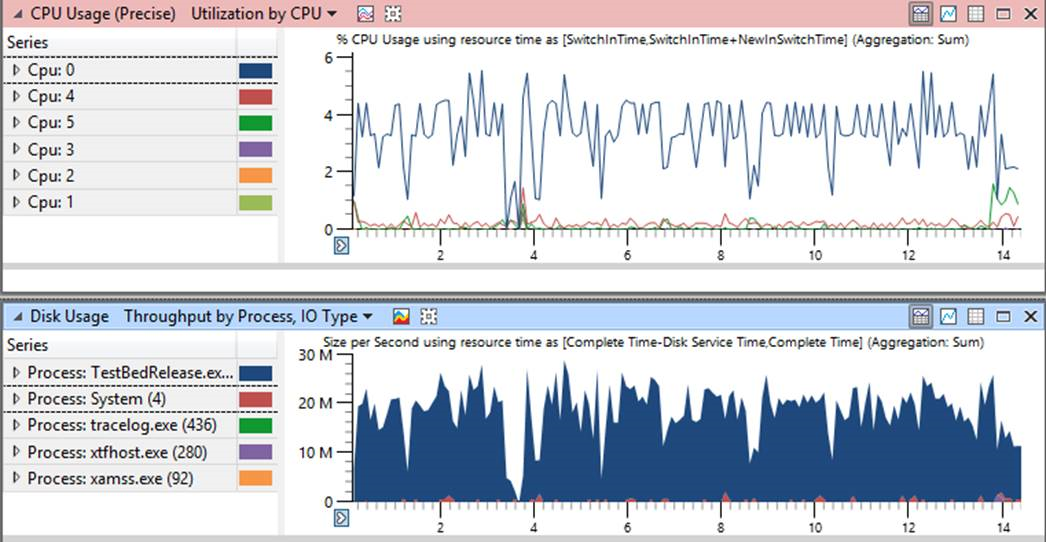 1. Zoom in to those areas and compare with the CPU Usage (Precise) Utilization by CPU window.
- If the CPU utilization is high during this time, the title is probably CPU bound. The title is not requesting data fast enough from the disk.
- Look for areas of poor utilization on the CPU by using the CPU Usage (Precise) Utilization by CPU window.
- Zoom in to those areas and compare against the Disk Usage Throughput by Process IO Type window.
- If the throughput is high during this time, the title is probably I/O bound. There is available time on the CPU to perform other work.
- If the matching areas between Disk Usage Throughput by Process IO Type and CPU Usage (Precise) Utilization by CPU are both poor, the title is I/O bound.
- The loading performance issues are probably caused by excessive seek times.
- Follow the steps in Low/Spiky throughput to narrow down the cause.
The PIX File IO Analysis Suite
Beginning with the February 2015 XDK, the Performance Investigator for Xbox (PIX) tool has gained an increasing set of functionality to assist in profiling disk usage and File IO performance. The tools offered by PIX are designed to be a complimentary toolset to WPA. While WPA provides great breadth and depth in the types of data it can present simultaneously, PIX is highly focused on profiling and analyzing targeted problems that game titles encounter.
In this section:
Taking File IO captures in PIX
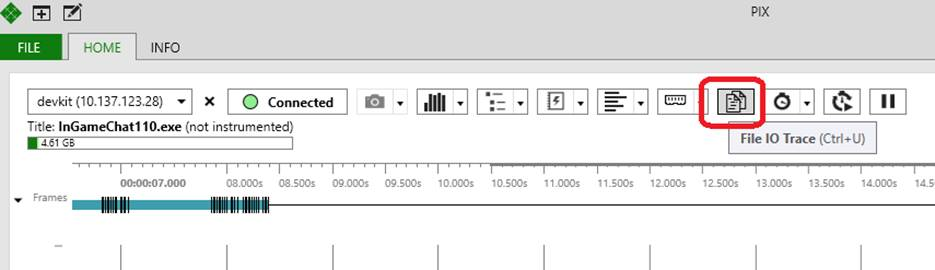
File IO captures in PIX are obtained by clicking on the highlighted capture button (File IO Trace) from the main view in PIX.
Figure 23. The File IO Trace button.
After the capture has started, PIX will present a status dialog allowing you to manually choose when to stop or cancel the capture. To complete the capture, click Stop at the desired time.
Figure 24. Completing the capture.
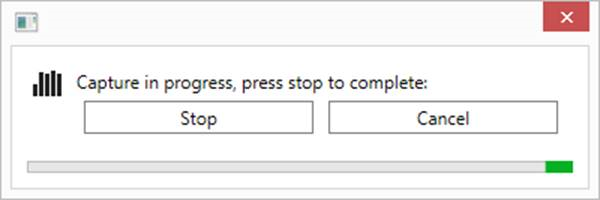
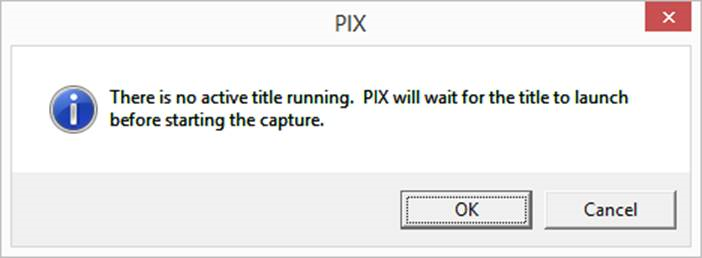
Figure 25. Alert message for capture.
The File IO analysis UI in PIX
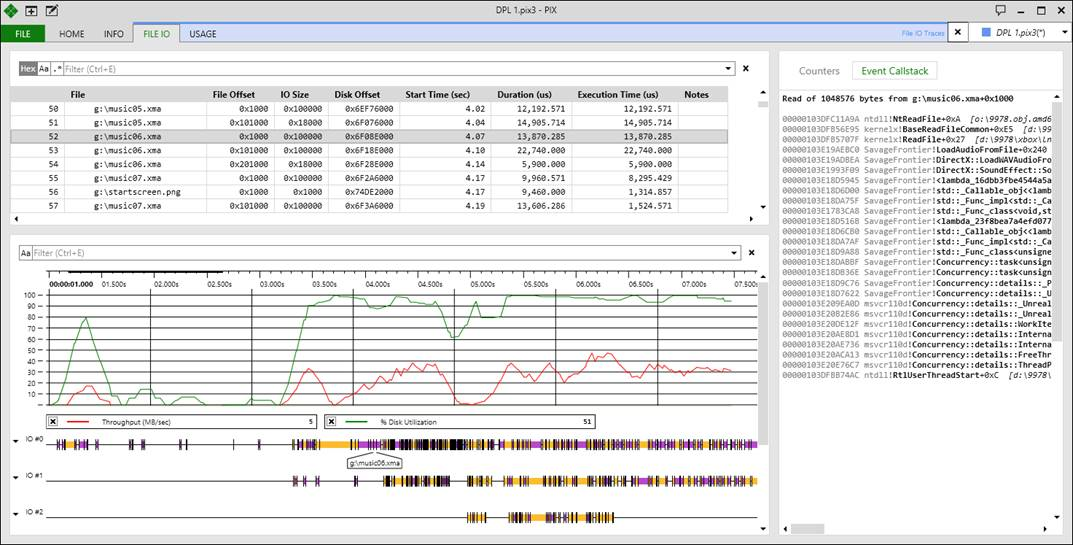
After a capture is completed, the data is analyzed and presented in the PIX UI. As of the June 2015 XDK, the UI contains 3 major components:
IO event list
A table of each file accessed in the capture with a breakdown and statistics of each section of each file that was touched.
IO event call stacks
A table of all disk IO events that were captured including the call stack that initiated the IO event.
IO event timeline
A visual representation of the disk IO events in a timeline along with derived statistics such as disk utilization, effective throughput, and overlapped requests.
Figure 26. Major components on the FILE IO tab: the IO event list, IO event call stacks, and the IO event timeline.
IO event list
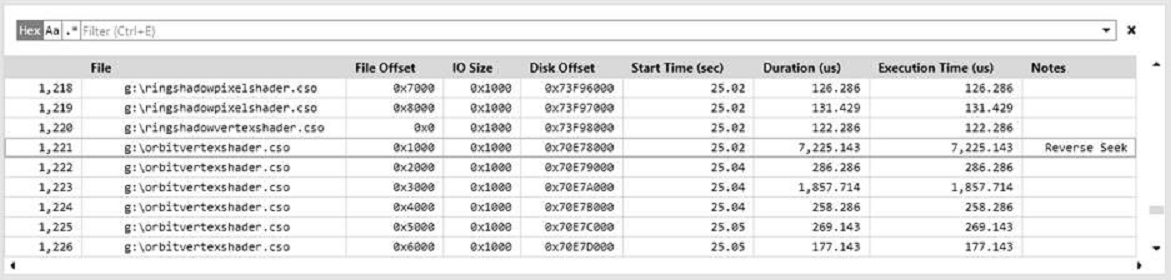
The IO event list, which is located in the upper-left corner of the FILE IO tab in the default PIX layout, provides a list of every File IO event (read or write) that occurs during the capture. At the time of writing this white paper, the events are filtered to just those that target the “G:" drive, but future versions of PIX will expand support to other partitions. Figure 27 is an example of the kinds of data that the event list provides.
Figure 27. Sample data in the IO event list.
Identifying what was accessed
Each row of the event list provides several pieces of data that aid in identifying which file and portion of the file was accessed.
- The File column lists the full path to the file on disk.
- The File Offset column lists the offset within the file where the read/write starts. Often games tend to have large files that are actually packages of other files (i.e., .bigfiles or .pak or .zip). In these cases, this column can be used to correlate the access against the manifest of what the actual file contents are. It is important to note that these values are from the perspective of the physical disk and are, therefore, aligned at 4 KB (4096 byte boundaries).
- The Disk Offset column lists the offset on the physical disk where the read occurred. This column is primarily useful for correlating the access against the equivalent field in WPA if both tools are used together. This column also drives the analysis for backwards or reverse seeks.
- The Hex button in the upper-left corner toggles the size and offset columns between hexadecimal and decimal display to enable PIX to match the display of external tools (such as WPA).
Computing throughput
The Execution Time and Duration columns provide two measures of the throughput for a given event.
- Execution Time is time that the physical disk spent satisfying the request. This is the same as Disk Service Time in WPA.
- Duration is the total time of the request including queueing time. This is the same as IO Time in WPA.
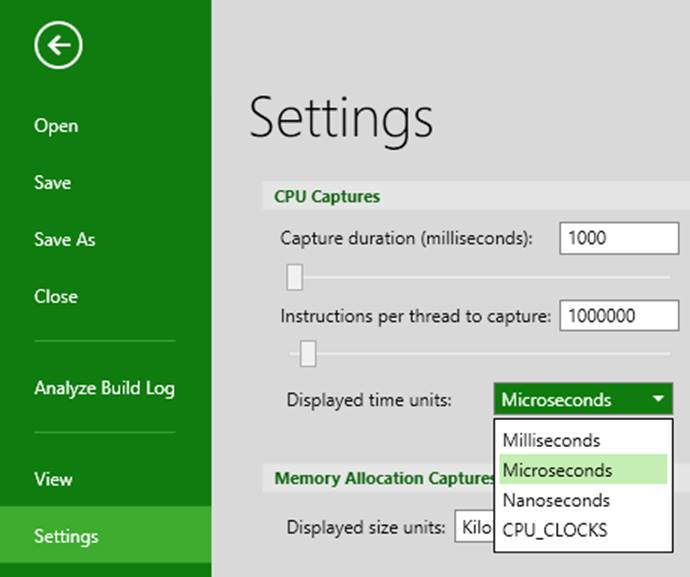
The units of these columns can be changed by using the Displayed time units setting in the PIX Settings window (also available on the INFO tab); see Figure 28.
Figure 28. The PIX Settings window.
When hand computing the throughput for a given IO request, it is advised to use IO Size/Execution Time instead of IO Size/Duration. Using Duration will result in values lower than the actual bandwidth that the title receives from the physical disk. It will also be incorrect when working with overlapped/asynchronous IO because a significant portion of the IO time will be spent queueing the request on the physical disk.
However, it is also important to mention that due to the nature of overlapped IO, the physical disk may be able to satisfy a queued request simultaneously with an active request. In these situations, the resulting Execution Time measurements can be impossibly short (such as 1 MB in 25us because that 1 MB was read/cached by the physical disk in the process of satisfying another larger read). For these reasons, both PIX and WPA employ rolling average style smoothing while graphing throughput.
Common performance problems
Unaligned starting offsets for small reads
This type of problem occurs primarily when the file contents are packages of other content (i.e., .zip, .pak, or .bigfiles). If the read is small in size (< 8 KB) and the starting offset is not 4-KB aligned, the physical disk will potentially read significantly more data than is required to satisfy the request. These situations can by identified by the value in the File Offset column not matching up with the manifest for the contents of that file. This is less of a problem for larger reads because the amount of “over reading” that occurs will be amortized over a larger transfer.
Backwards/reverse seeks
PIX performs similar calculations to what was described earlier for the WPA data. If a backwards seek is detected, a comment is added into the Notes column. PIX employs a time-window heuristic of 10 msec (approximate 1 rotation of a 5400 RPM HDD) when identifying reverse seeks. This heuristic is subject to change as the tool is refined in the future.
IO event call stacks
PIX displays the call stacks for each IO event in a call stack window to the right of the event list. The data presented in this window is enhanced beyond what WPA provides to enable developers to more quickly perform follow-up operations such as reviewing source code or setting breakpoints.
Figure 29. IO event call stacks.
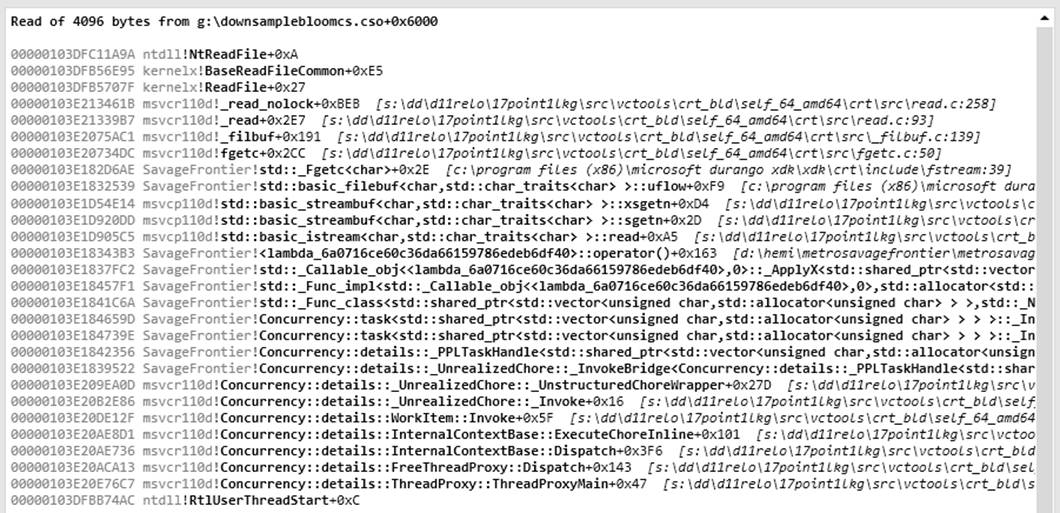
The first line of the call stack view is a synopsis of the event that is selected from the IO event list. Each line afterwards is the stack frame leading up to the read file.
00000103E1932CAF SavageFrontier!TextureCache::LoadCompressedTexture+0x18F [d:\SF\texturecache.cpp:309]
Each line is composed of several pieces of information:
- The virtual address (00000103E1932CAF) of the call to the next function in the call stack . Useful for setting breakpoints if the title is still active.
- The module name and function name (SavageFrontier!TextureCache::LoadCompressedTexture) of each function involved in the event.
- The byte offset (0x18F) within the function. Useful for lining up the call in disassembly.
- The file and line number ([d:\SF\texturecache.cpp:309]), if available in the pdb file, for the call.
IO event timeline
The lower-left pane of the FILE IO tab in the default PIX layout is a graphical representation of the events listed in the IO event list.
The top half of this view charts Throughput and % Disk Utilization over time. Both PIX and WPA employ rolling average smoothing to remove jitter in these graphs.
The bottom half of this view provides a timeline visualization of each IO event. The number (#) of swim lanes that are populated at any given time should track closely with the QD/I column of WPA. Orange is used to distinguish queueing time while magenta is used to distinguish execution time.
Figure 30. Graphical representation of the IO events.
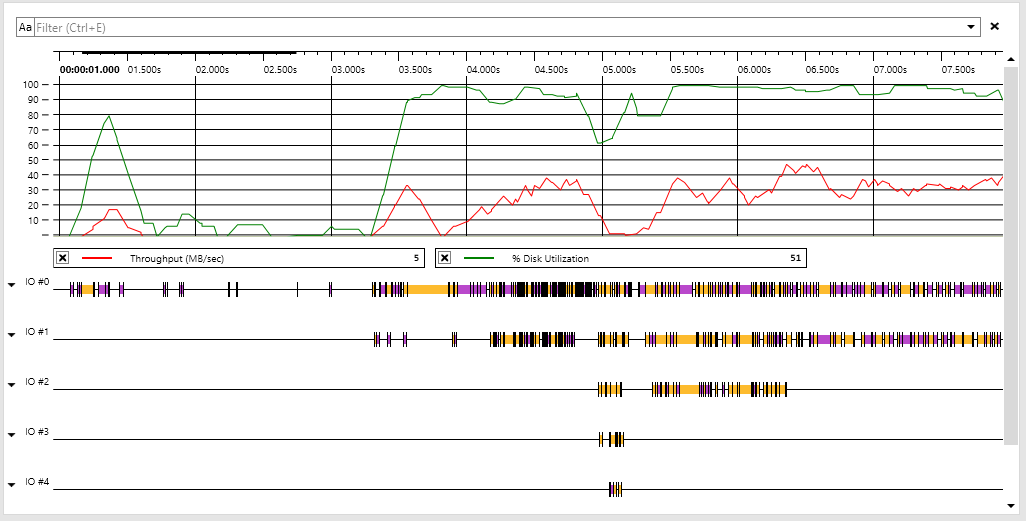
Identifying areas of interest
The following chart is the same as Figure 30 with different areas of interest marked off.
Figure 31. A view of graphical representation of IO events with regions marked off.
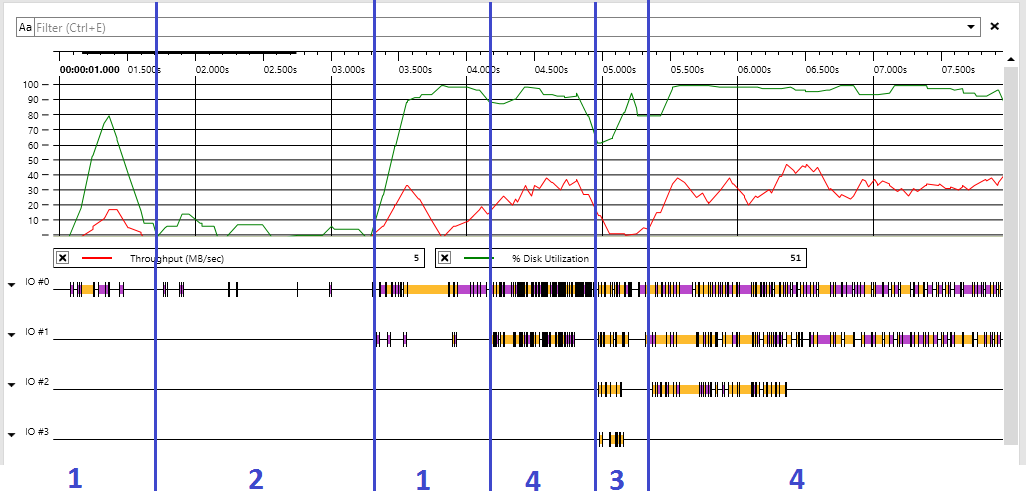
- Region 1. This region shows high disk utilization (the disk is nearly fully committed) yet low bandwidth. In addition, the lack of entries in the alternate swim lanes (such as IO #1 or IO #2) suggest that this period of the loading sequence consists of serial reads. This suggests that this portion could be optimized by using overlapped IO.
- Region 2. This region shows a period of no disk activity in between two periods of disk activity. At the timescale shown (~8 seconds), this indicates a stall in the title code issuing read requests. This suggests that the overall loading sequence could be shortened by eliminating this stall.
- Region 3. This region contains high disk utilization as well as overlapped IO but low throughput. There are several possible reasons this might occur including backwards seeks, random accesses, and unaligned small reads. This suggests that this period could be optimized through file ordering and possibly consolidation of content. Further analysis can be performed by reviewing the specific events in the IO event list.
- Region 4. This region shows consistent high throughput, which is likely obtained by using overlapped IO. This is the ideal situation.
File usage list
Another common mistake that can slow down loading sequences is reading the same content multiple times. PIX can surface this detail in the file usage list on the USAGE tab.
Figure 32. File usage list on the USAGE tab.
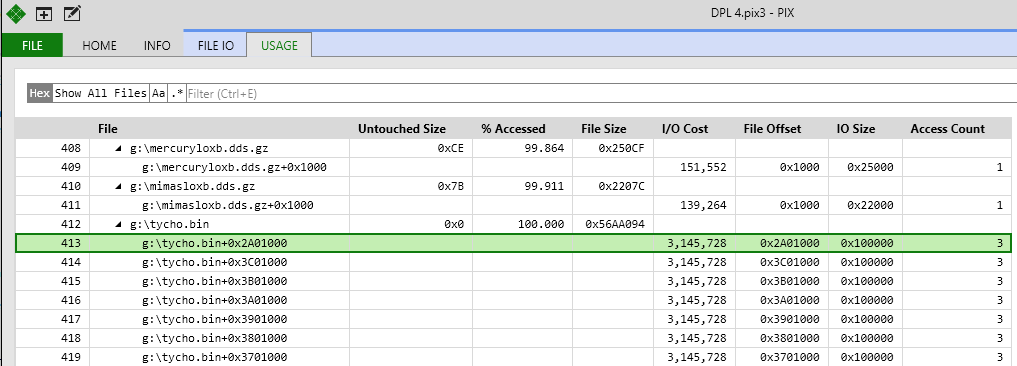
The USAGE tab contains a list of each file that was read/written during the capture period, the ranges of each access, and the number of times the range was read/written. In Figure 32, various portions of tycho.bin were loaded multiple times costing significant time. Click the Access Count column to sort by that column and surface the worst offenders to the top of the list. See also redundant reads earlier in this paper.
Summary
Following these steps should put you well on your way to locating the cause of common loading issues. If any of your questions were not answered, please visit the Developer Forums. There is a wealth of information there along with people who can help answer your questions.
Appendix A: Access patterns
Buffered vs unbuffered
- Buffered
- Pros
-
Matches CRT implementation for cross-platform work.
- Cons
- Dirties the fixed 16-MB cache. High likelihood of purging useful directory information.
- Requires extra memcpy from the cache.
- Harder to correlate profiling data to actual read requests. Profiling data based on actual requests going to the physical disk.
-
- Unbuffered
- Pros
- Highest throughput.
- Will not dirty the fixed 16-MB cache.
-
Easier to correlate profiling data to actual read requests. Profiling data is based on actual requests going to the physical disk.
- Cons
- Requires 4-KB alignment and granularity on file location and read size.
- Pros
Blocking vs overlapped
- Blocking
- Pros
- Matches CRT implementation for cross-platform work.
-
Does not require as much memory. Can fully read one item at a time and clean up temporaries between reads.
- Cons
- The OS cannot reorder reads to match the layout on the disk. High likelihood of longer seek times between reads.
- Overlapped
- Pros
- Highest throughput on data reads.
-
OS can reorder reads to match the layout on the disk. Reduction in seek times.
- Cons
- Requires memory buffers for all pending requests in flight.
- Requires unbuffered I/O with 4-KB alignment and granularity.
- Pros
Appendix B: Batch file to create traces
        echo OFF
        REM Use the name on the command line for the capture or use the default
        set ETWName=%1
        if "%1"=="" set ETWName=FileData

        set SavePath=d:\
        xbdir /x/title xd:\profile > NUL
        if %ERRORLEVEL% EQU 0 set SavePath=%SavePath%profile\

        REM Start the capture on the default Xbox
        xbrun /x/title /O tracelog -start %ETWName% -f %SavePath%%ETWName%.etl -eflag PROC_THREAD+LOADER+FILENAME+DISK_I/O+DISK_I/O_INIT+INTERRUPT+CSWITCH+PROFILE -stackwalk PROFILE+CSWITCH+DiskRead+DiskWrite+DiskFlush

        REM Wait for the user to press a key when the session has finished capturing
        PAUSE

        REM Stop the capture, merge the file to resolve events, finally copy the etl file over to the PC
        xbrun /x/title /O tracelog -stop %ETWName%
        xbrun /x/title /O tracelog -merge %SavePath%%ETWName%.etl %SavePath%%ETWName%_merge.etl
        xbcp /x/title x%SavePath%%ETWName%_merge.etl
        start %ETWName%_merge.etl