Analyzing Memory Allocations
On the Xbox One, Exclusive Titles have up to 5GB of memory available. For many reasons, performance chief among them, there is no disk paging of this memory once it is consumed. Therefore, managing memory is a vital aspect of successful game development on Xbox One. This 5GB memory is allocated into two broad categories: Title Allocations and Legacy Allocations. The reference page for the TITLEMEMORYSTATUS Structure has a detailed breakdown of the differences between Title and Legacy allocations. The table below contains the most common ways memory is allocated into either title or legacy allocations.
| Allocation Type | Description |
|---|---|
| Title Memory | All platform and title allocations going through XMemAllocAll platform and title allocations going through VirtualAlloc with MEM_GRAPHICS or MEM_TITLE flags. |
| Legacy Allocation | All other allocations made with VirtualAllocExecutable images loaded into memoryThread stacks |
Taking the Trace
- Create a .cmd file named TakeTrace.cmd using notepad and copy the following script into it:
REM GET PID for /f "usebackq" %%i in (`xbtlist /x/title ^| findstr /ic:^"g:^"`) do ( set pid=%%i ) REM start trace xbrun /x/title /O tracelog -start mysession -f d:\test.etl -heap -eflag Base+VIRT_ALLOC -stackwalk HeapAlloc+HeapRealloc+VirtualAlloc -b 1024 -min 30 -max 30 -pids 1 %pid% ECHO press any key to stop the trace pause xbrun /x/title /O tracelog -stop mysession xbrun /x/title /O tracelog -merge d:\test.etl d:\test.merge.etl xbcp /x/title xd:\test.merge.etl - Optionally enable collecting data to inspect RtlAllocateHeap by performing the following steps:
- Create a .cmd file named track_heap.cmd using notepad and copy the following script into it:
REM copy this to d:\boot (or {@scratch}:\boot) in order to turn on stack walking for heap allocations FOR /F %%f in ('dir /b g:\*.exe') do ( reg add "HKLM\Software\Microsoft\Windows NT\CurrentVersion\Image File Execution Options\%%f" /v TracingFlags /t REG_DWORD /d 1 /f ) - While your title is not running, copy the track_heapalloc.cmd script to
D:\bootxbmkdir {@scratch}:\boot xbcp track_heapalloc.cmd {@scratch}:\boot
- Create a .cmd file named track_heap.cmd using notepad and copy the following script into it:
- Launch your title. Optionally, if you want to track allocations from boot, start the title under the debugger while breaking on the first statement.
- Run the TakeTrace.cmd script.
- If launching the title from the debugger, press F5/Start Debugging in the debugger to allow your title to continue running.
- When you want to end the trace, press a key in the cmd window that TakeTrace.cmd is running in. This should result in a file called “test.merge.etl” on your local PC.
Analyzing the Trace
There are several ways to inspect and analyze memory usage on Xbox One. The TitleMemoryStatus function provides a high level view of the current memory consumption of the running title. This API can be called as needed to track memory usage over time. Additionally, all allocations that are made through XMemAlloc can be monitored (or overridden) with a title provided callback through the XMemSetAllocationHooks function. With proper use of this API, titles can track nearly every allocation made from the title code as well as the majority of the platform code. In addition, with tracelog and WPA, developers can get a detailed view of all allocations (both Title and Legacy) that are made by the system during a capture period.
With limited exception, all allocations funnel down into ntdll.dll!ZwAllocateVirtualMemory. Analyzing this is best done by finding all callstacks ending in this API.
- Open test.merge.etl in Windows Performance Analyzer (WPA). Make sure you are using the WPA recommended by the XDK (see Windows Performance Analyzer).
- Load symbols in WPA.
- Open the Trace -> Configure Symbol Paths menu
- Add in paths for the Xbox One XDK symbols (c:\Program Files (x86)\Microsoft Durango XDK\xdk\symbols) and your own title symbols
- Run Trace -> Load Symbols
 Note Loading the symbols can take a long time.
- In your trace, expand the Memory segment. It should expand into something like the following image:
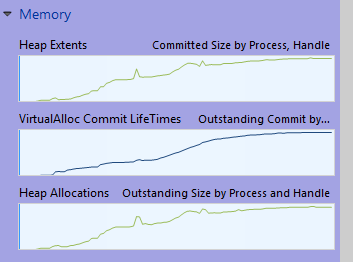
- You would use VirtualAlloc Commit Lifetimes to analyze AllocateVirtualMemory and Heap Allocations to analyze RtlAllocateHeap.
- Drag the appropriate graph to the right side of the screen to analyze that graph.
- Right click on the column headers and select Commit Stack and deselect other non-relevant columns.
- Drag the Commit Stack column to the left of the yellow bar. The resulting view should be similar to this:
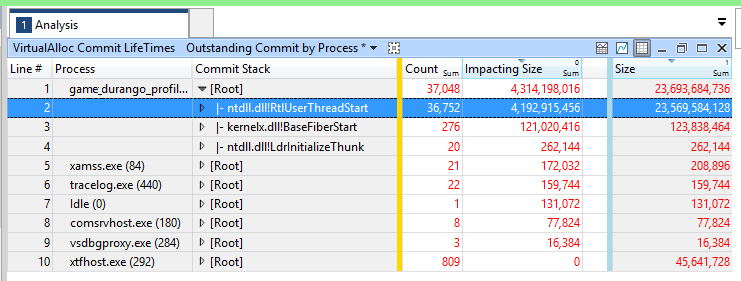 Note The relevant size column is Impacting Size which represents memory that was allocated but not freed during the trace. This number should match closely with the overall memory consumption of your title.
 - Expand the commit stacks until you see a call to ZwAllocateVirtualMemory. You’ll see that it is being called repeatedly and that there are some very common call stacks here.
- To coalesce these into unique stacks, you want to turn this upside down into a callers view.
- Sort the calls into unique stacks by right clicking on ZwAllocateVirtualMemory and selecting View Callers, By function.
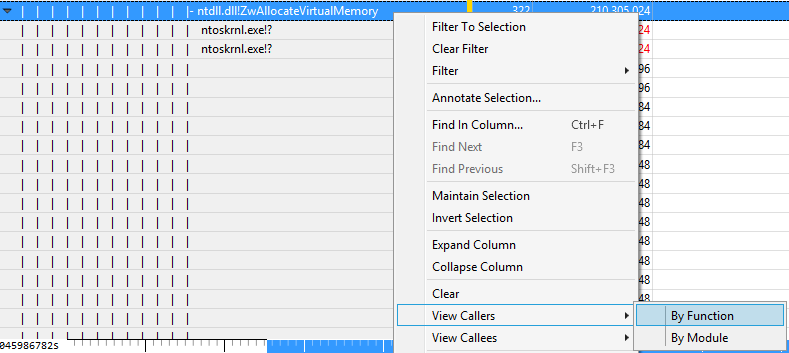
- Once the calls are sorted into unique stacks, you can drill down into each of the call trees that end up allocating memory.
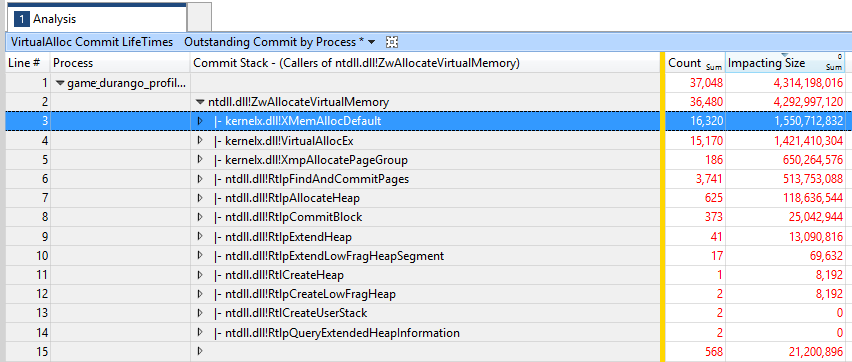 Some key points to remember:
- Anything going through XMemAlloc will be attributed to title memory.
- Anything going through VirtualAlloc with MEM_GRAPHICS or MEM_TITLE will be attributed to title memory.
Legacy Memory Used by Executable Images
The memory required to load the executable code for a title is considered a legacy memory allocation. Typically this is somewhere between 130-180MB of memory. To identify the amount of memory used in this way, attach a debugger to the title and inspect the address ranges assigned to each loaded module. Add up the deltas between start and end to get an overall memory consumption used in this way.
Legacy Memory Used by Thread Stacks
The memory required to create stack space for each thread comes from virtual memory but is allocated in the kernel instead of in ntdll as above. The amount of memory used for stack space depends on the compiler and image headers settings but often defaults to 1MB. Inspecting memory utilized in this way is similar to the technique for analyzing ntdll.dll!ZwAllocateVirtualMemory but with the kernelx.dll!CreateThread API as the callstack selection.