PIX Custom Memory Allocators
Describes integrating data from custom memory allocators into the PIX Memory Profiler.
- Reporting Memory Allocations and Frees from Custom Allocators
- Viewing your Allocation and Free Events in PIX
Reporting Memory Allocations and Frees from Custom Allocators
The PIXRecordMemoryAllocationEvent and PIXRecordMemoryFreeEvent APIs allow you to provide the data that PIX needs to display information about all memory allocations made from within your title’s custom memory allocators in memory profiling captures. By providing this data PIX will show all the same data for your custom allocators that it does for calls to VirtualAlloc/VirtualFree and HeapAlloc/HeapFree.
This feature can be used to instrument your title so that calls to XMemAlloc and XMemFree are tracked as well.
To call PIXRecordMemoryAllocationEvent and PIXRecordMemoryFreeEvent and to view the resulting data in PIX, you’ll need to include pixmemory.h in your source code, and ensure that USE_PIX is defined. Call PIXRecordMemoryAllocationEvent and PIXRecordMemoryFreeEvent as shown in the following example:
            #include "pixmemory.h"
            void* TitleAllocate(size_t size, UINT64 metadata)
            {
              void *pAddress = layer_allocate(size);
              if (pAddress == NULL)
                return NULL;
              PIXRecordMemoryAllocationEvent(TITLE_ALLOCATOR, pAddress, size, metadata);
                return pAddress;
            }
            void TitleFree(void* baseAddress, size_t size, UINT64 metadata)
            {
              layer_free(baseAddress, 0);
              PIXRecordMemoryFreeEvent(TITLE_ALLOCATOR, baseAddress, size, metadata);
            }
Note The current version of the PIX memory profiler does not automatically track calls to XMemAlloc and XMemFree. By calling PIXRecordMemoryAllocationEvent and PIXRecordMemoryFreeEvent to your XMemAlloc and XMemFree hooks you can use the PIX memory profiler to view these memory events as well. In this case, consider using a consistent allocator ID so you can easily distinguish XMemAlloc and XMemFree events from the other allocation types when viewing the capture.
Viewing your Allocation and Free Events in PIX
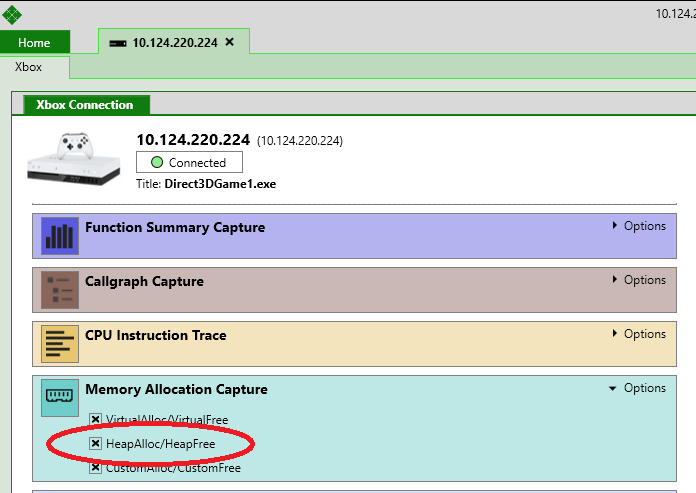
To see memory events corresponding to your calls to PIXRecordMemoryAllocationEvent and PIXRecordMemoryFreeEvent, select the HeapAlloc/HeapFree checkbox before starting a memory capture:
Figure 1. Check before starting a memory capture
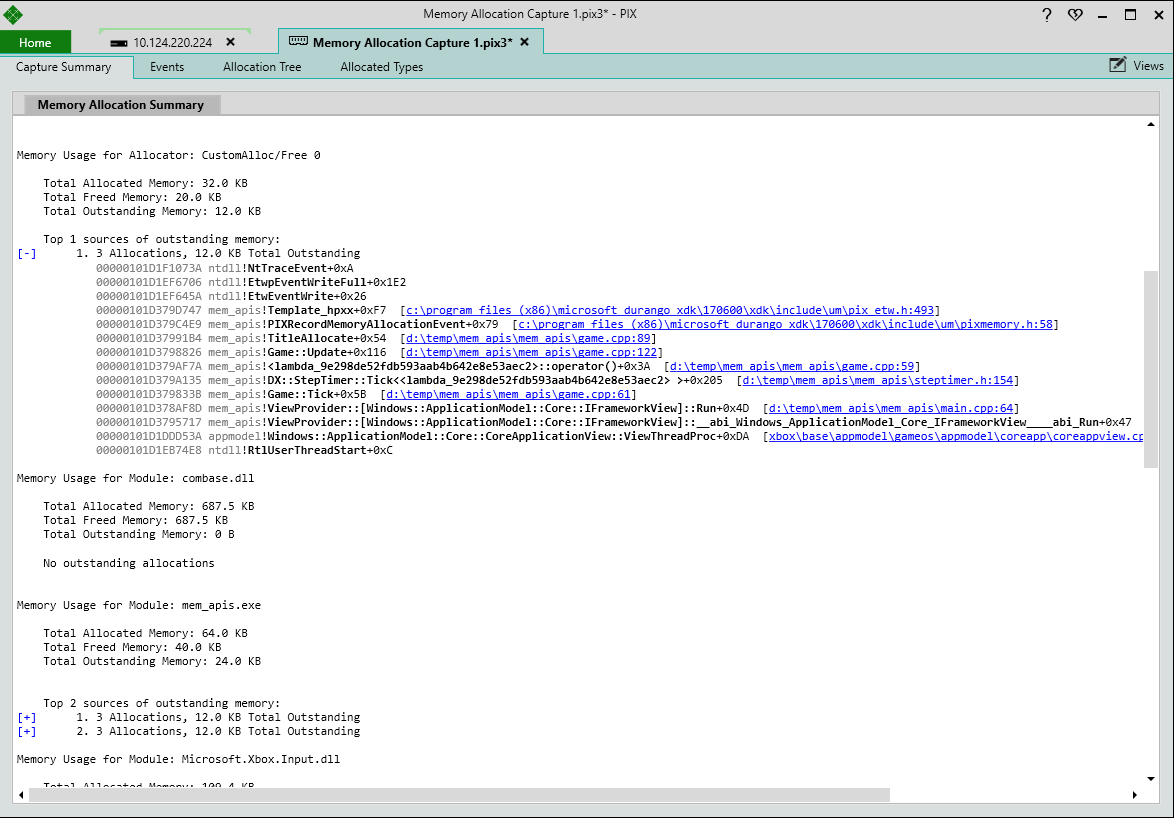
PIX will display information about your custom allocations and frees alongside the data for other allocation types. In the following figure, the Capture Summary tab shows your top outstanding allocations complete with callstacks.
If PIX detects any regions of memory that were marked as allocated twice without a free in the middle, it reports those instances to you along with the callstack responsible.
Figure 2. Custom memory allocation summary
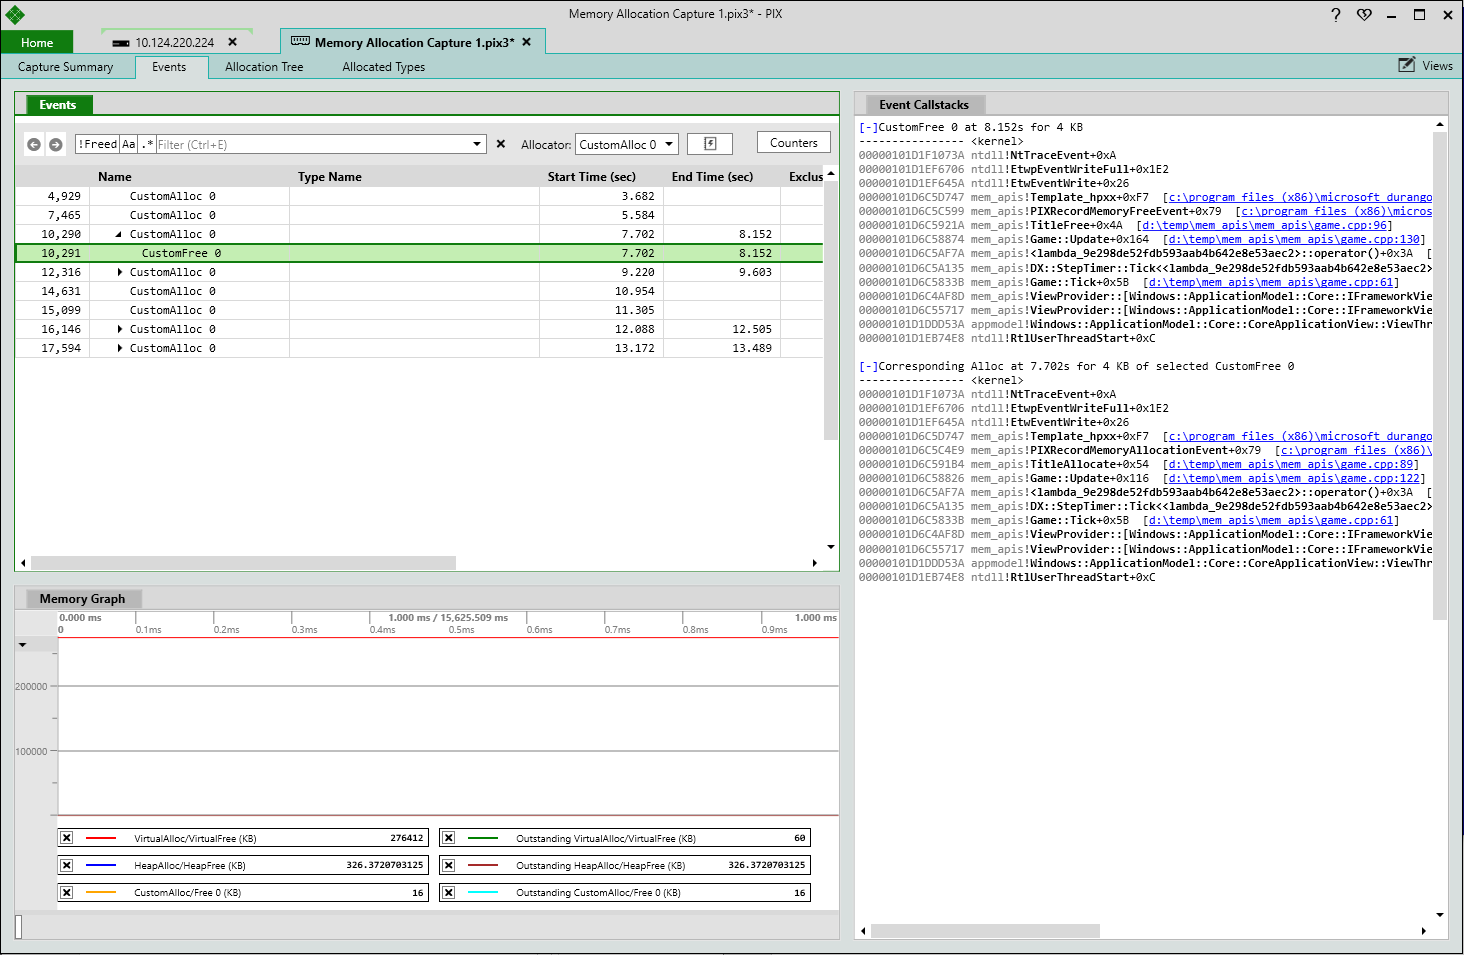
The Events tab of the memory capture will include one row for each of your custom allocations and frees. Here the Allocator dropdown can be used to filter the data in the events list to see that data only from a custome allocator. The Memory Graph at the bottom also contains a line for each custom allocator.
Figure 3. Custom memory allocation events