PIX Memory Captures
- Overview
- Initiating a Memory Capture
- Capture Summary Tab
- The Memory Events Tab
- The Allocation Tree Tab
- Data Type Tracking in Memory Allocation Captures
- White Papers
Overview
Memory captures provide statistics on physical and virtual memory usage and help you find leaks and unexpected allocation patterns in your title. PIX uses a combination of standard and custom ETW providers to track allocations made by VirtualAlloc and VirtualFree, HeapAlloc and HeapFree, XMemAlloc and XMemFree, or from any custom memory allocation routine defined by your title.
Refer to PIX Custom Memory Allocators for information on how to update your custom allocators so that PIX can track the memory they manage.
Initiating a Memory Capture
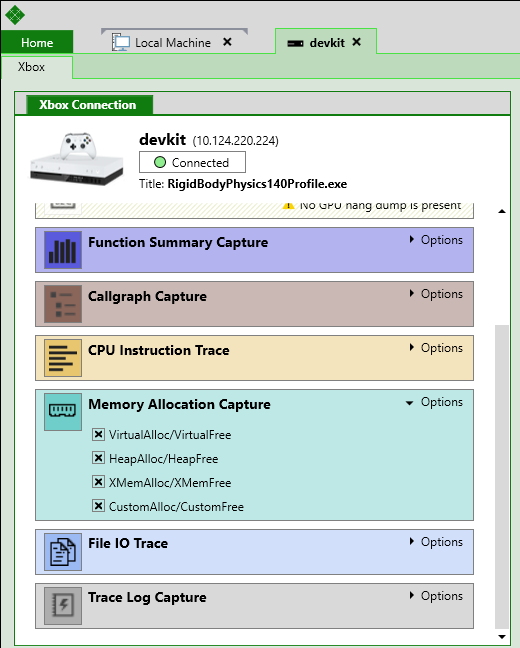
To start a memory capture, choose the allocation types you’d like to track using the options checkboxes, then select the Memory Allocation Capture button on the Device Connection tab.
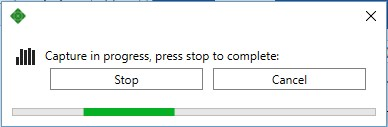
When the capture starts running, you’ll see a dialog that lets you either stop or cancel the capture. Memory captures can run for relatively long periods of time. It’s common to use memory captures to profile a level load, or a play through of a significant part of your game.
When you press the Stop button, the collection of ETW data will stop and PIX will open the capture.
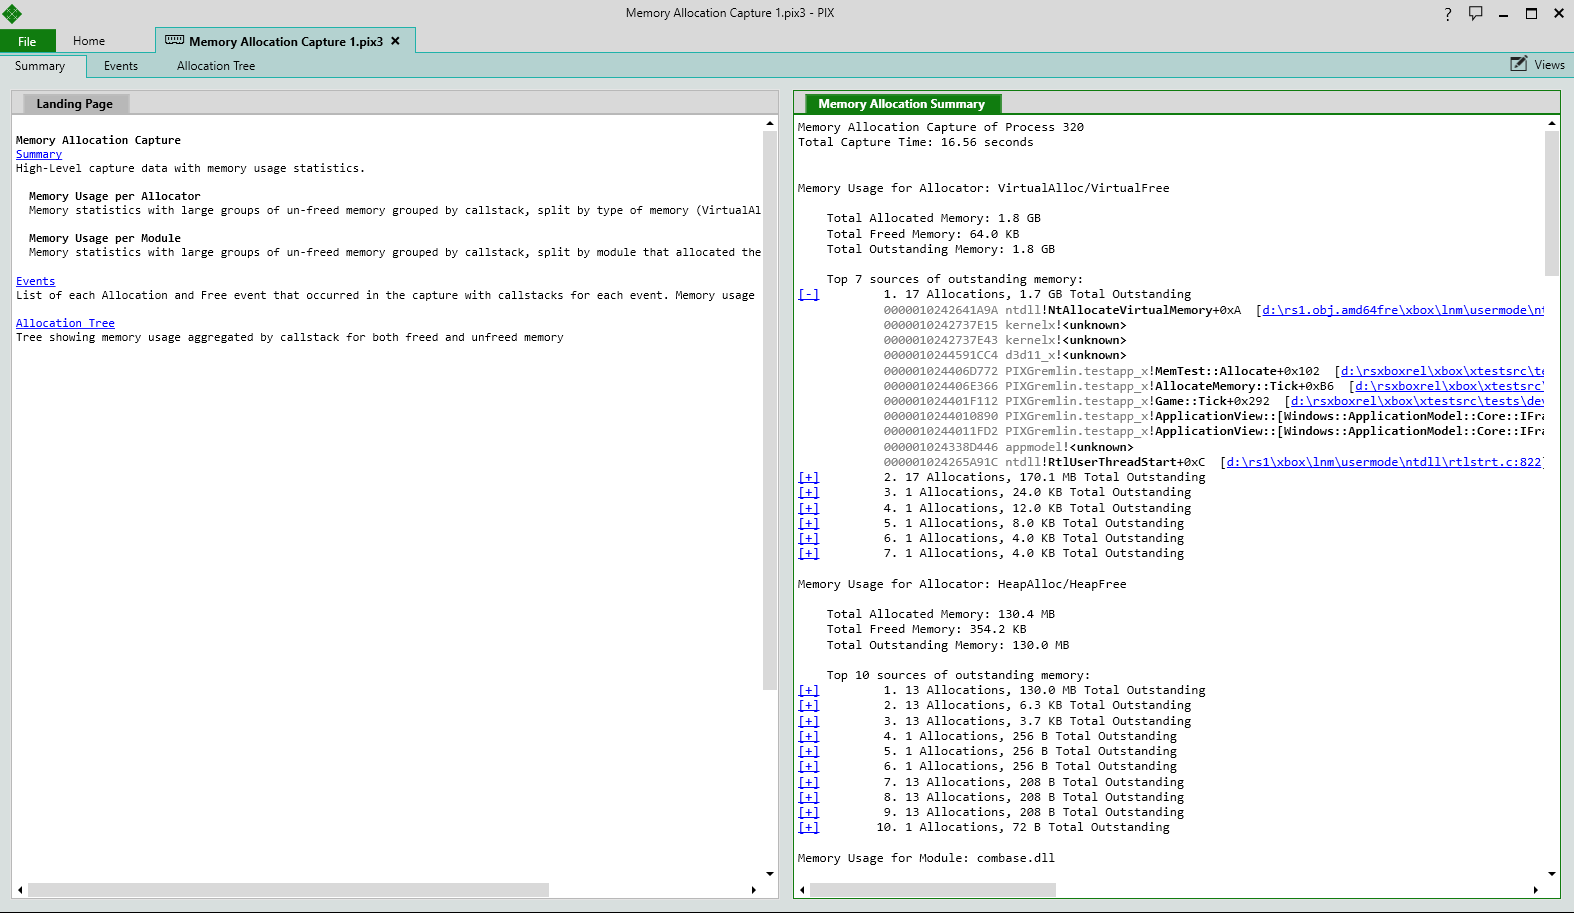
Memory captures open to a tab called the Capture Summary tab.
Capture Summary Tab
The Capture Summary tab provides basic statistics about the memory allocated during the capture, along with the top sources of memory that were allocated but not freed and a description of the amount of physical and virtual memory currently being used.
The statistics include the total amount of memory that was allocated, the amount that was freed, and the amount outstanding.
All statistics and sources of outstanding memory are broken out by allocation type (VirtualAlloc, HeapAlloc, XMemAlloc or custom) and the module in the title from which the allocations came.
Full callstacks are provided for the top sources of outstanding memory.
Physical Memory Usage Table
The Capture Summary tab also includes a physical memory usage table that indicates how much of the physical memory available to the Exclusive Partition is used by the legacy, title, and tooling working sets. This table helps you account for all the memory available on your devkit.
The data needed to populate the physical memory table is gathered both at the beginning and end of your capture so that differences in memory usage over the lifetime of the capture can also be displayed.
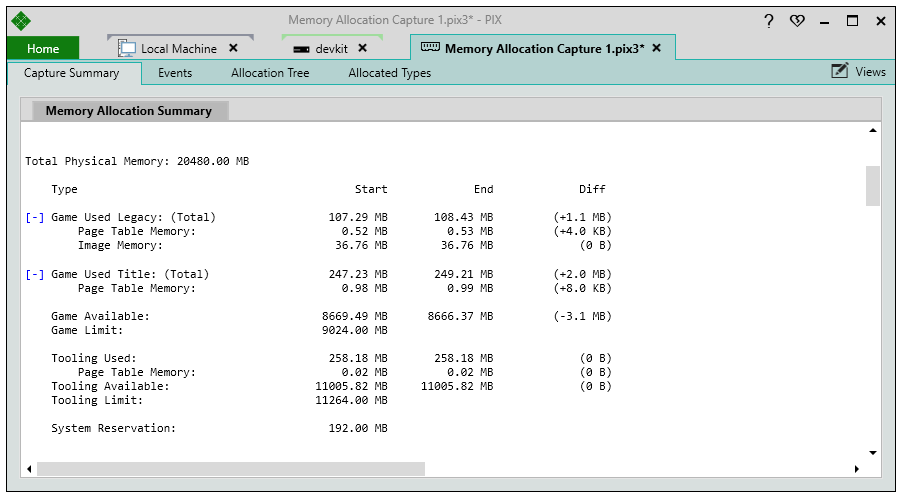
The total amount of physical memory available to the Exclusive Partition is displayed at the top of the table. This amount will be approximately 20 GB for titles built with the June 2017 XDK or newer running on a Project Scorpio devkit. On an Xbox One or Xbox One S devkit, this amount will be approximately 5 GB.
The rest of the table groups physical memory into the following categories:
Game Used Legacy
Legacy memory includes:
- Memory allocated by VirtualAlloc where neither the MEM_TITLE, MEM_TOOLING or MEM_GRAPHICS flags have been specified. Some components of the system allocate memory in this way.
- The amount of memory needed to hold executable images. These images may be either part of your title or part of the operating system that runs in the Exclusive Partition.
- The amount of memory needed by the system to store the page table entries for all pages in the legacy working set.
Game Used Title
Title memory is the combination of any memory allocated by passing the MEM_TITLE or MEM_TOOLING flags to VirtualAlloc and the memory required by the system to store page table entries for all pages allocated in the title working set.
Game Available
The amount of memory currently available to the title. This amount is:
Game Limit – (Game Used Legacy + Game Used Title)
Game Limit
The maximum amount of memory available to your title. The default value for Game Limit is approximately 8 GB for titles built with the June 2017 XDK or newer running on a Project Scorpio devkit. If you have an Xbox One or an Xbox One devkit the default value for Game Limit is approximately 5 GB.
This value can be changed using either DevHome, the Xbox One Manager, the xbConfig command line tool or Xbox Device Portal. See Configuring and Accessing Tooling Memory for more details.
Tooling Used
Tooling memory is any memory allocated by passing the MEM_TOOLING flag to VirtualAlloc. See Configuring and Accessing Tooling Memory for more details on allocating tooling memory. The amount of memory used by the system to store page table entries for all tooling memory is also included in the Tooling Used category.
Tooling Available
The amount of tooling memory currently available on your devkit. This amount is:
Tooling Limit – Tooling Used
Tooling Limit
The maximum amount of tooling memory available to your title. The default value for Tooling Limit is approximately 12 GB for titles built with the June 2017 XDK or newer running on a Project Scorpio devkit. If you have an Xbox One or an Xbox One devkit the default value for Tooling Limit is approximately 1.25 GB. This value can be changed using either DevHome, the Xbox One Manager, the xbConfig command line tool or Xbox Device Portal. See Configuring and Accessing Tooling Memory for more details.
Virtual Memory Usage Table
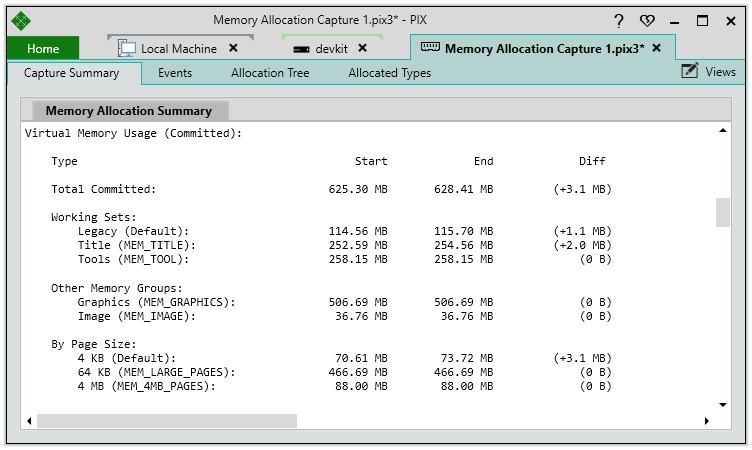
The virtual memory usage table describes the makeup of committed virtual memory. The table categorizes virtual memory both by the working sets or other memory groups to which allocations belong, and by the page size of the allocations.
The data needed to populate the virtual memory table is gathered both at the beginning and at the end of your captures so that differences in memory usage over the lifetime of the capture can also be displayed.
The Memory Events Tab
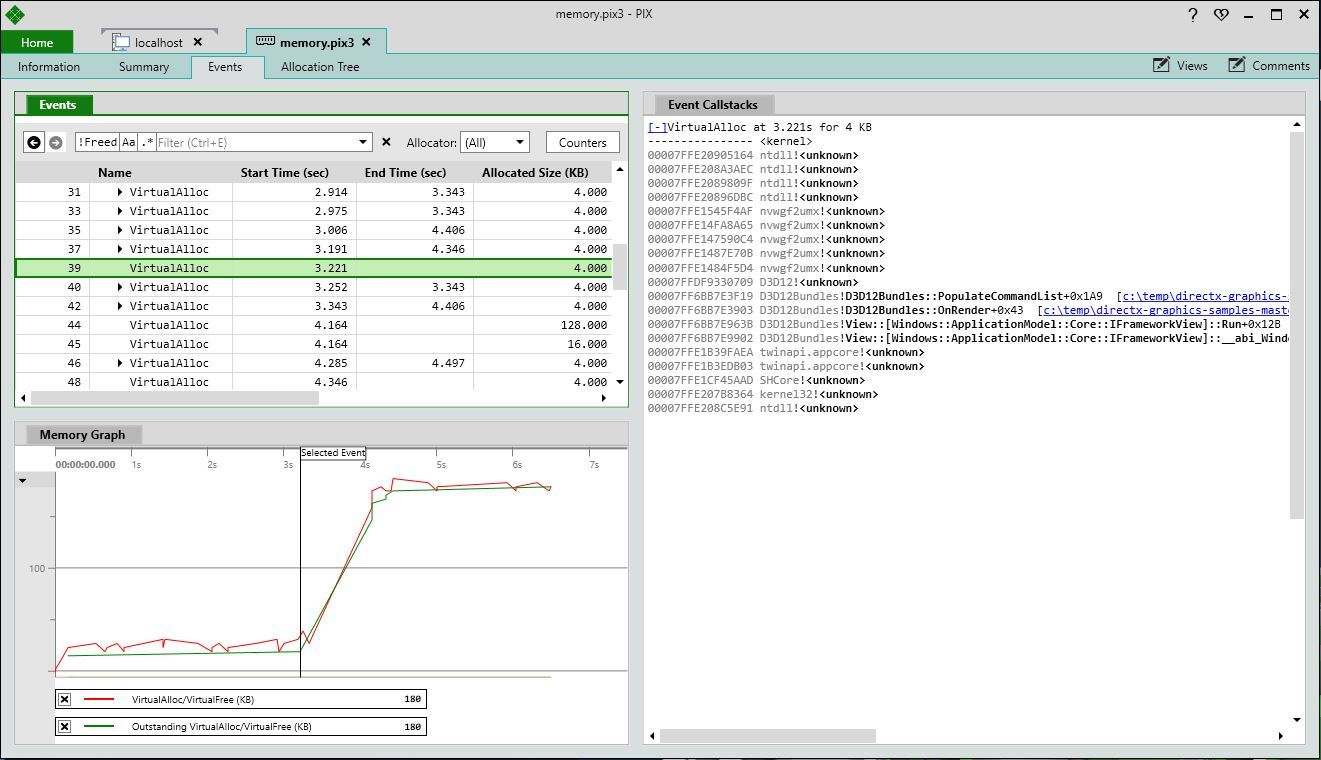
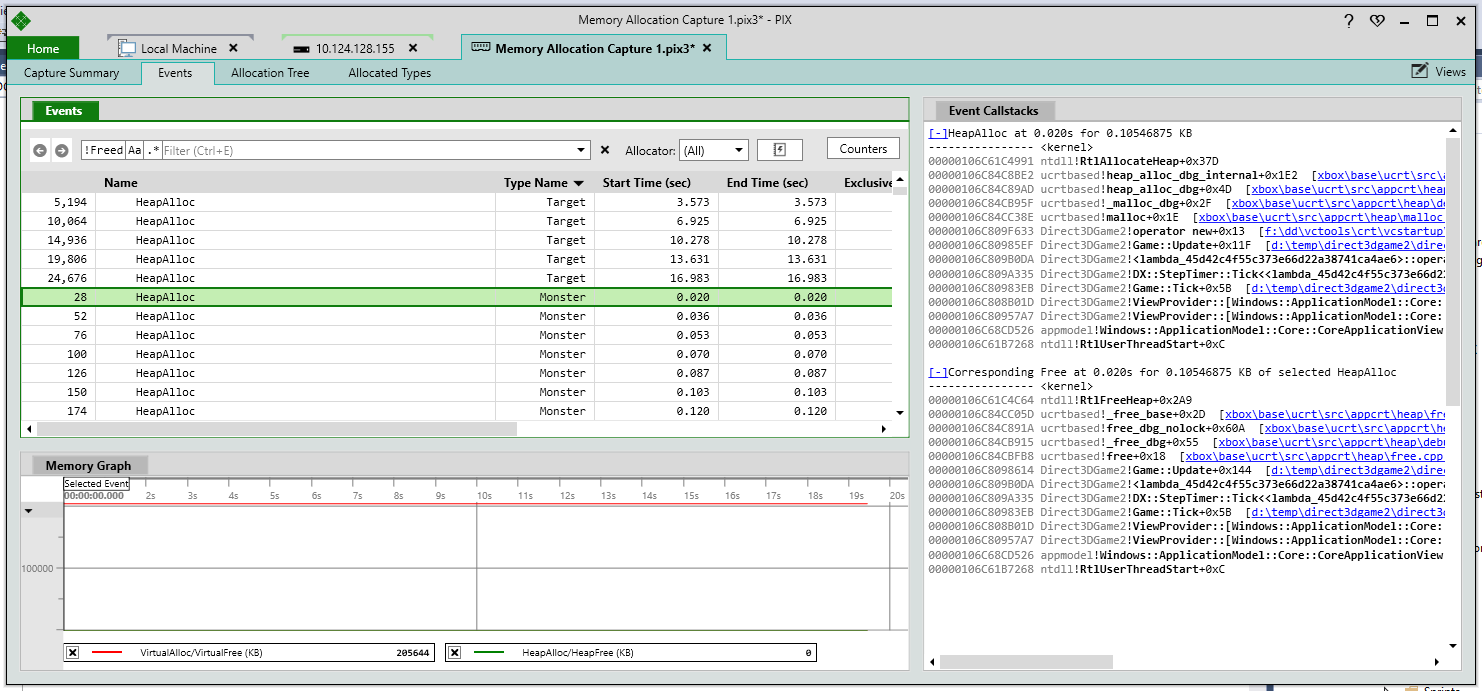
The Events tab includes an event list, a graph of allocated and outstanding memory(Memory Graph), and a callstack view(Event Callstacks). The Events list contains one row for every memory allocation made while the capture was running. If that allocation was also freed, the row representing the allocation can be expanded to see the corresponding free.
The Event Callstacks view contains the full callstack for the allocation (and it’s corresponding free if it exists) for the row currently selected in the events list.
You can use the Allocator drop down to filter the data in the events list to a specific allocation type. Filtering the data in this way allows you to see only data for VirtualAllocs, HeapAllocs, XMemAllocs or any of your custom allocators.
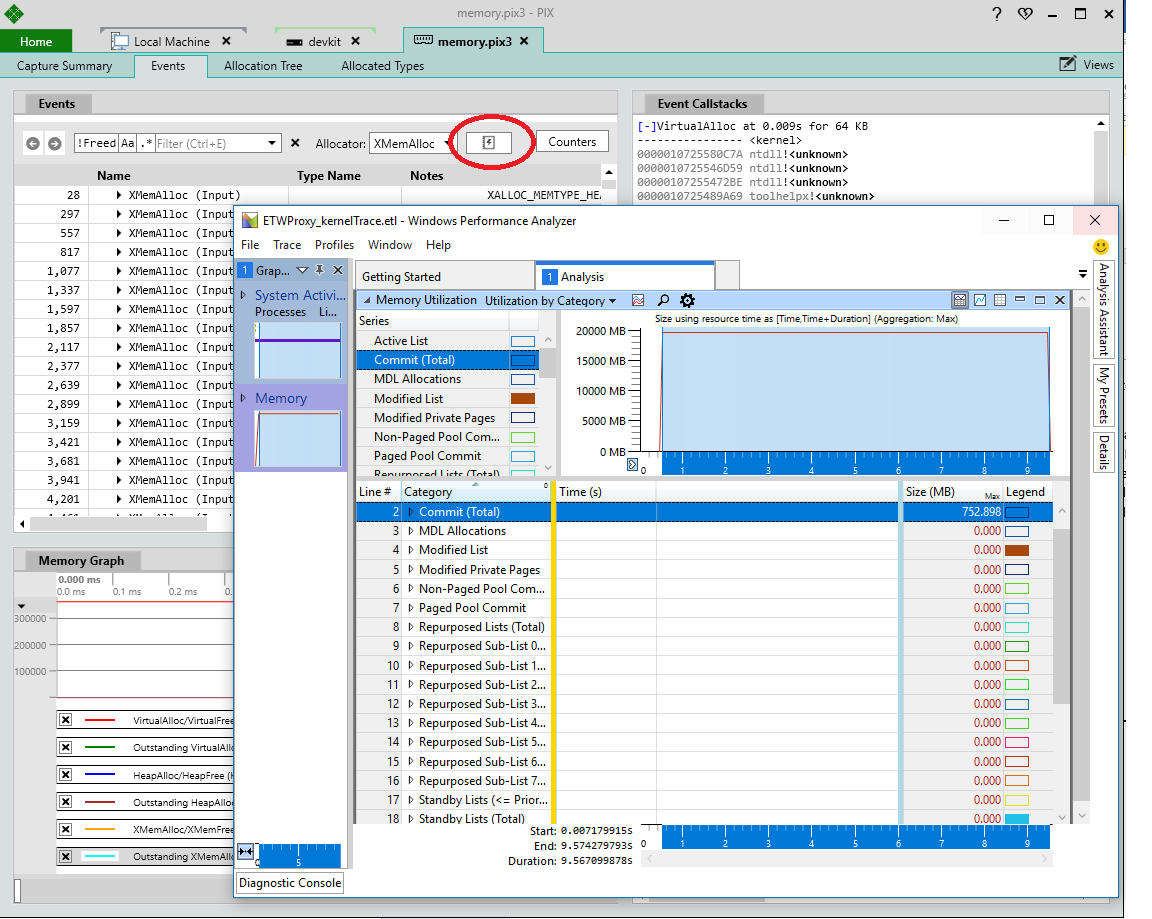
The rows in the Events list corresponding to allocations made with XMemAlloc include the allocator id and the rest of the contents of the XALLOC_ATTRIBUTES structure. The allocator id is part of the text displayed in the Name column. The remaining contents of the XALLOC_ATTRIBUTES are displayed in the Notes field.
In addition to helping you spot memory leaks, the Memory Graph can also help you see unintended memory allocations. For example, it’s common to allocate all the memory needed for a particular level of your game when the level is loaded. In this scenario, you’d expect no additional allocations to occur once the level is loaded.
If you run the memory profiler over a period of time in which you expect memory to be at a steady state, yet the contents of the graph show the amount of allocated memory increasing, then your title isn’t holding to the steady state you expect. Selections made in the graph are synchronized with the Events list, and vice versa. If the graph shows you an unexpected increase in allocated memory, selecting that portion of the graph will select the allocations responsible for the increase in the Events list. The Event Callstacks view will also be updated to show you the specific location in your title that performed the allocation.
Opening Memory Capture data in Windows Performance Analyzer
The memory profiler uses ETW events to collect the data it displays. This data is stored in a file that can be opened using Windows Performance Analyzer (WPA). WPA provides some additional views of the data that PIX does not. These additional views may be required at times to help you diagnose memory issues in your title.
Use the Open in WPA button on the filter bar to open the underlying .etl file in WPA.
The Allocation Tree Tab
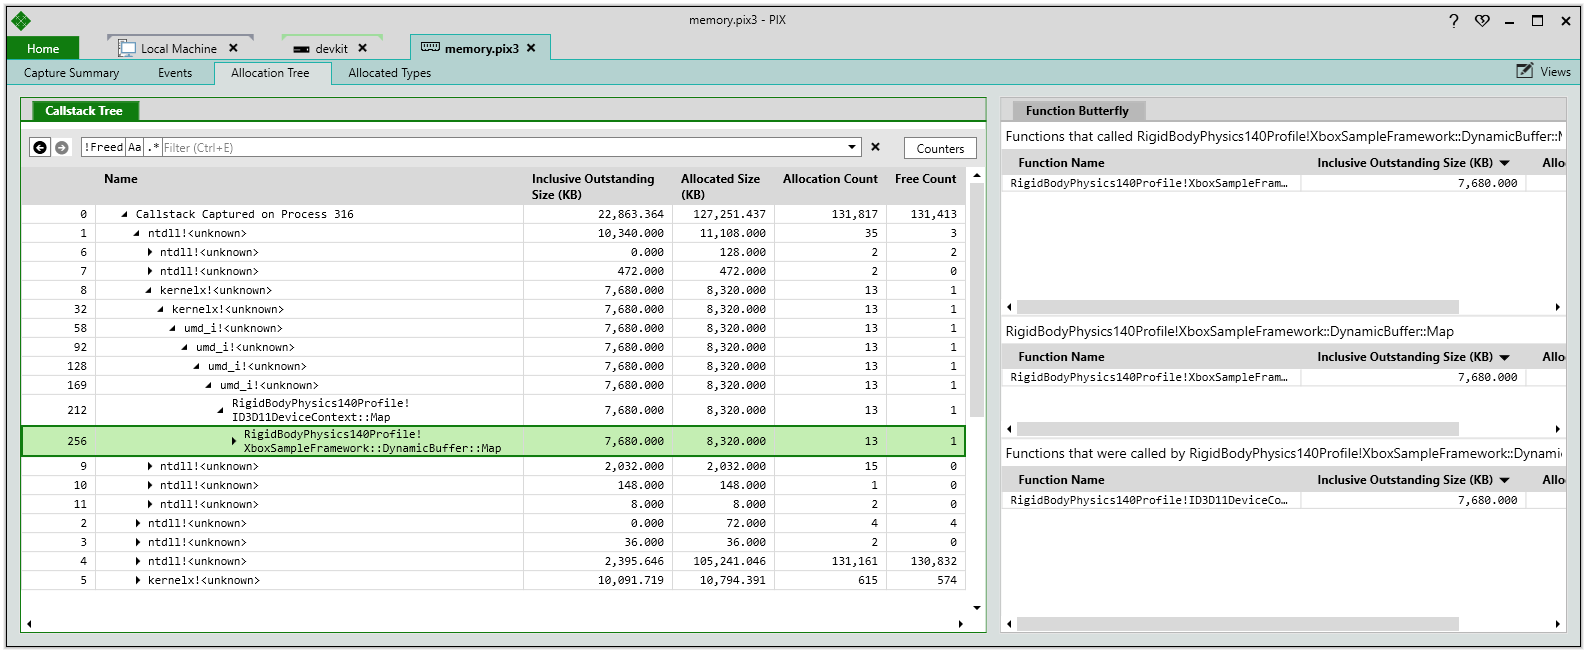
The Allocation Tree tab shows the full callgraphs for all allocations made during the capture.
This tab is useful for drilling down to discover which functions allocated memory that was not freed. The Events list contains columns describing the amount of memory that was not freed for each level of the callgraph (Inclusive Outstanding Size) as well as the amount of memory that was allocated and the number of allocations and frees.
Selecting the !Freed button on the filter bar will filter the event list to those functions in the callgraph that allocated memory that was not freed.
The Function Butterfly view helps you drill down by providing the callers and callees for each function, along with the amount of outstanding memory for each function.
Data Type Tracking in Memory Allocation Captures
The PIX memory profiler will show data type information for heap allocations when it’s available. Type information will be available if the following two conditions are met:
- The function that allocated the type has been decorated with __declspec(allocator)
- PIX can find your title’s PDB.
The memory allocation routines in the default heap are already decorated with __declspec(allocator) so unless you have custom memory allocation routines, there is no other work you’ll need to do related to __declspec(allocator). If your heap allocations are coming from somewhere other than the default heap, see the blog post on tracking custom allocations for instructions on how to use __declspec(allocator).
The “Setting PDB Paths” section of the Function Summary Capture page provides instructions for configuring PIX to find your title’s PDBs. If you’re profiling on the same machine you just built your title on, the path to the PDB that the compiler stored in your title’s modules is typically all PIX needs to locate the PDB. Otherwise, there are options on the Settings page to point PIX at your PDBs.
Type information is shown in two places in a memory capture.
First, the event list on the Events tab has a column called Type Name in which the name of the allocated type is displayed. PIX will only be able to display the type name if the allocation routine was decorated with __declspec(allocator) as described above.
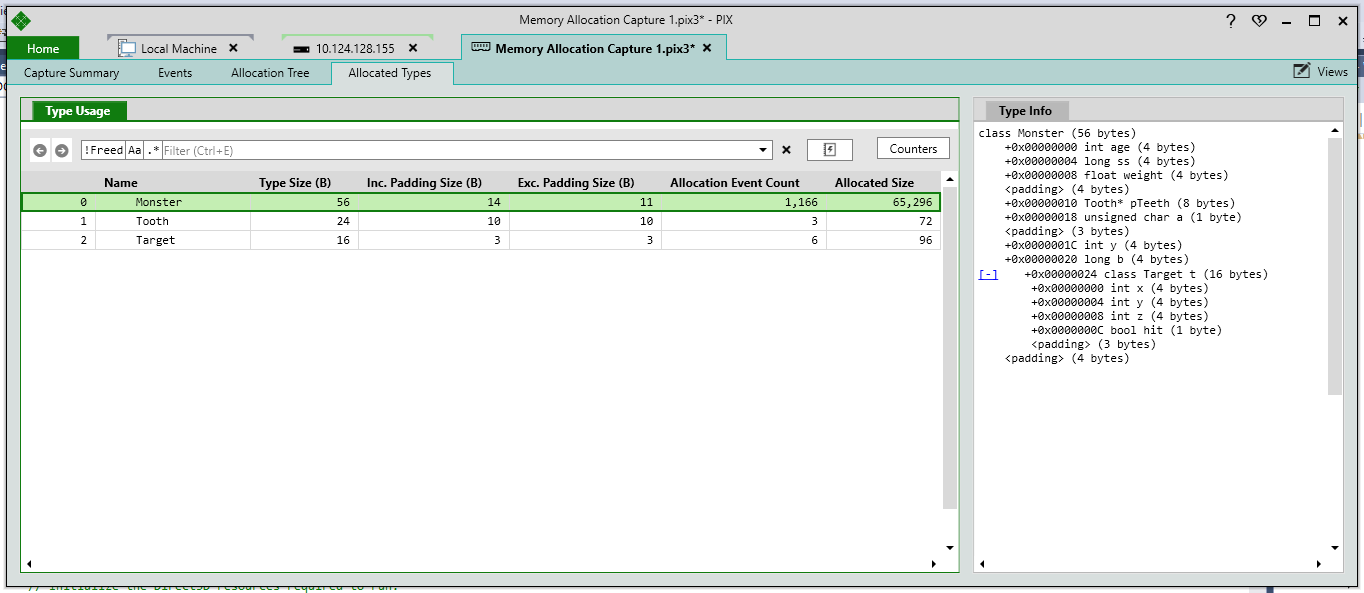
Type information is also displayed on the Allocated Types tab. Statistics are provided for every type that was allocated while the capture was running. These statistics include the size of the type, the amount of padding in the type’s definition, the number of instances of the type that were allocated and the total number of bytes those allocations took up in the heap.
Selecting a column sorts the event list based on the data in the column. Sorting can quickly help you see info ranging from which types were allocated most frequently to which types have the most padding.
Selecting a row in the event list populates the Type Info view with details of the type’s layout. The Type Info view will show you the offset and size of each field in the type. Nested types can be expanded and collapsed. The layout also tells you exactly where the padding sits within your type information. This padding information helps you determine whether your layout can be optimized to reduce wasted space.
White Papers
- No Problem: A Practical Look at PIX
- Xbox One Memory Performance
- Xbox One Memory System
- Xbox One XDK Memory Management