Configuring and Accessing Extra Memory during Development
When ProfilingMode is enabled, extra memory is made available to your title that can be used during development for anything from game engine tools to unoptimized game assets.
This extra memory is shared between the title and tooling such as PIX. The total amount of memory that is available when ProfilingMode is enabled depends on the devkit hardware and, for an Xbox One X dev kit, the console mode:
| Dev Kit Type | Total memory available with ProfilingMode enabled |
|---|---|
| Xbox One and Xbox One S dev kit | 6.25 GB |
| Xbox One X dev kit | 22.25 GB |
| Xbox One X dev kit in Xbox One X Test Mode | 10.25 GB |
| Xbox One X test kit | 10.25 GB |
The amount of extra memory available beyond the title’s retail configuration is simple to calculate:
Extra memory available = Total memory available with ProfilingMode enabled - TitleMemory size
TitleMemory size is fixed at 5GB for Xbox One titles. For Xbox One X titles, TitleMemory size can be configured using the TitleMemory app manifest setting and ranges from between 5 GB and 9 GB. See <mx:TitleMemory> Element for more details.
The extra memory is made visible to the title in two ways:
- The ExtraTitleMemory config setting can be used to specify how much extra memory is made available directly to your title via all of the standard memory allocation routines.
- Any memory not assigned via the ExtraTitleMemory setting can be accessed by specifying the MEM_TOOL flag when calling VirtualAlloc or HeapAlloc. See the Allocating Memory on the MEM_TOOL heap section below for more information on how to use the MEM_TOOL heap in your tools.
The ProfilingMode and ExtraTitleMemory config settings can be set using DevHome, Xbox One Manager, Xbox Device Portal (Windows Device Portal on Xbox), or the xbConfig command line tool.
Important Notes:
- Using extra memory in your title reduces the amount of memory available to tools like PIX. We recommend leaving at least 512MB of memory for PIX.
- Tools generally allocate memory using the MEM_TOOL flag. When the MEM_TOOL pool is exhausted they will attempt to allocate from the default memory pool unless ToolingMemoryOverflow is set to false. Note that there are still some cases where PIX and other tooling may take title memory even if you’ve specified that it shouldn’t using the ToolingMemoryOverflow setting. These cases will be fixed in a future release of the XDK.
- Changing Console Modes does not change the Profiling Mode setting. Extra Memory will still be available to your title and to PIX and tools. To turn off extra memory, turn off Profiling Mode. See Using Console Modes on Xbox One X Dev Kits to Test Your Game for more information on Console Modes.
- CAUTION: If you are running your title on the October 2017 recovery, turning on ProfilingMode causes the TitleMemory app manifest setting for your title to be ignored and the TitleMemory value is set to 9GB. This is fixed in the November 2017 and later recoveries.
Turning on Profiling Mode
To access extra title memory, you turn on Profiling Mode in the Performance tab in DevHome, the settings tab in Xbox One Manager, the settings page in Xbox Device Portal (Windows Device Portal on Xbox), or the xbConfig command line tool.
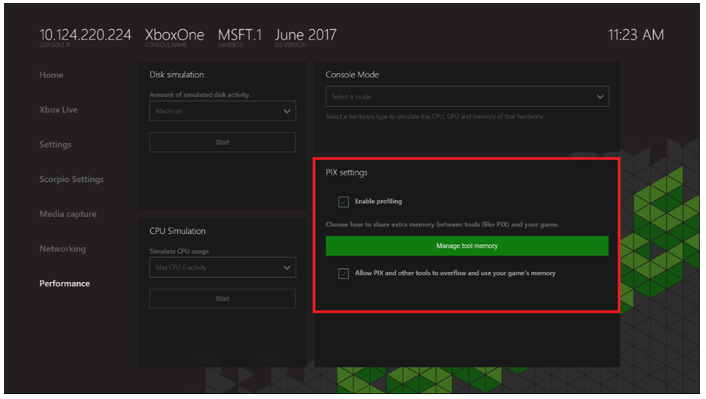
In DevHome, you turn on Profiling Mode using the PIX settings in the Performance tab. You can also select Allow PIX and other tools to overflow and use your game’s memory if you want tools to spill into title memory if needed.
Configuring Extra Title Memory
Once profiling mode is turned on, you can configure how much extra memory is made directly available to your title and how much is made available on the MEM_TOOL heap. By default, no extra memory is made available to your title. You can change this default in the Performance tab in DevHome, the settings tab in Xbox One Manager, the settings page in Xbox Device Portal (Windows Device Portal on Xbox), or the xbConfig command line tool.
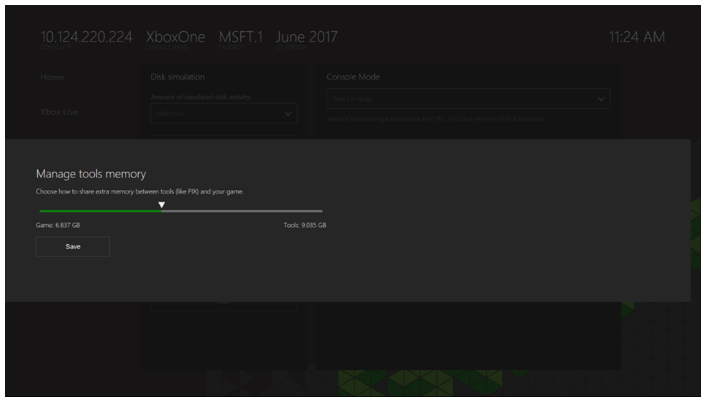
In Dev Home, selecting the Manage tool memory button in the PIX settings in the Performance tab brings up a slider control that lets you configure how much extra memory to give to your title:
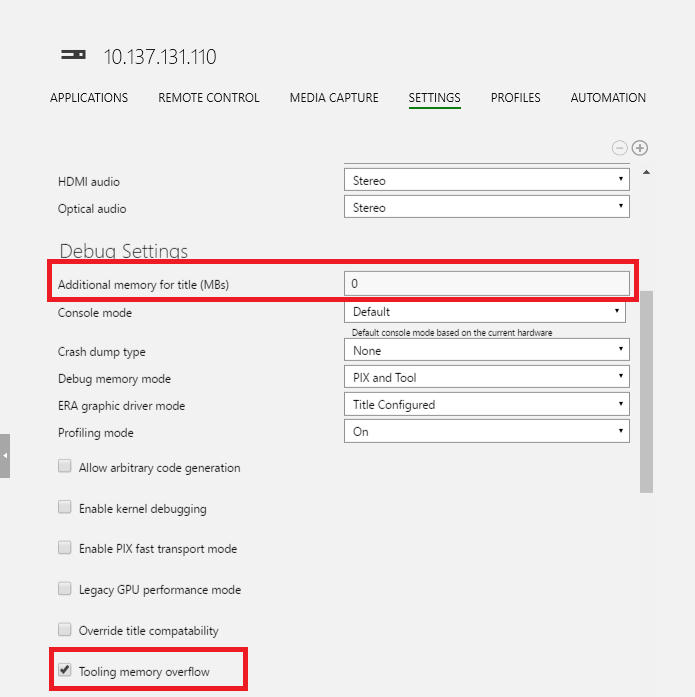
Xbox One Manager and Xbox Device Portal (Windows Device Portal on Xbox) expose the ability to configure extra memory using the Additional Memory for Title and Title Memory Overflow settings. Specifying a value for Additional Memory for Title will expand title memory (and shrink tooling memory) by the number of MBs you indicate.
To configure extra memory using the xbConfig command line tool, use the ExtraTitleMemory and ToolingMemoryOverflow settings.
Allocating Memory on the MEM_TOOL heap
You can access memory on the MEM_TOOL heap by specifying the MEM_TOOL allocation type flag to either VirtualAlloc or HeapCreate:
PVOID addr = VirtualAlloc(nullptr, size, MEM_TOOL, ...);
    HANDLE ToolMemHeap = HeapCreate(HEAP_TOOL, 0, 0);
    PVOID addr = HeapAlloc(ToolMemHeap, size);
Note that these allocations will fail if the requested amount of tooling memory is not available.
Allocations made with the MEM_TOOL flag are guaranteed to not take away title memory, with one exception. Allocations made with (MEM_TOOL | MEM_GRAPHICS) will impact title memory. Although the memory itself does not come from the title space, the page table entries for graphics memory will come from the title space.
Querying Memory on the MEM_TOOL heap
The ToolingMemoryStatus API can be used to get current statistics about memory on the MEM_TOOL pool including its configured size, the amount of memory that is currently available and so on.
TOOLINGMEMORYSTATUS toolingMemoryStats;
toolingMemoryStats.dwLength = sizeof(TOOLINGMEMORYSTATUS);
BOOL bSuccess = ToolingMemoryStatus(&toolingMemoryStats);
Deprecated APIs
The DebugMemGetRegion API was used in previous versions of the XDK to get access to a region of debug memory up to 768 MB in size. This API now deprecated and has been removed from the XDK.