PIX Function Summary Captures
1. Overview
Function Summary Captures are instrumented CPU captures that help you quickly find the most expensive functions in your title in terms of execution time or PMC value. These captures can run for a relatively long period of time, on the order of several seconds. By default, PIX records information about every function that executes while the capture is running. The information PIX collects includes entry and exit counts, inclusive and exclusive execution times, information about the callers and callees for every function, and statistics on inlined functions. The values of 4 Performance Monitoring Counters (PMCS) can also be collected.
Instrumented CPU captures in PIX, including Function Summary Captures, are built on a technology called dynamic instrumentation. Where other instrumented profilers require a special build of the program to insert the instrumentation hooks, PIX inserts these hooks dynamically. When you start a capture, PIX uses the information from PDBs (primarily) to find the addresses of your title’s functions and inserts entry and exit hooks on the fly. The ability to gather instrumented profiling data without an additional rebuild and redeploy offers a significant savings in iteration time.
2. Setting PDB Paths
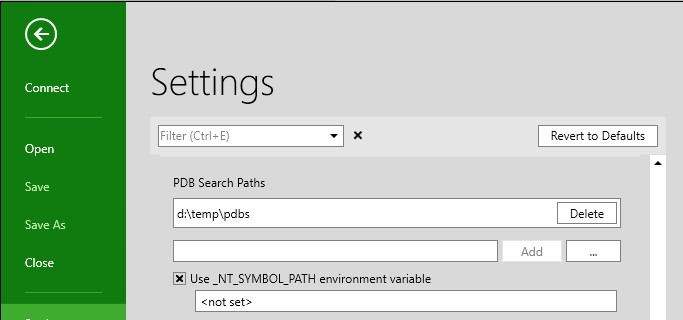
PIX uses your title’s PDBs to determine the addresses of the functions to dynamically instrument. If you’re profiling on the same machine you just built your title on, the path to the PDB that the compiler stored in your title’s modules is typically all PIX needs to locate the PDB. However, there are scenarios in which you’ll need to explicitly tell PIX where your PDBs are located. This situation often occurs if you’re profiling your title on a different machine than the one used to build it. In this case, you can point PIX to your PDBs either by setting the _NT_SYMBOL_PATH environment variable, or by using the “PDB Search Paths” option on PIX’s Settings page.
3. Initiating a Function Summary Capture
Function Summary captures are initiated using a button on your device connection tab. By default, Function Summary captures run for one second, but that time duration can be customized by setting the Duration option before you start the capture.
You can also select a set of 4 PMCs to collect. The list of available PMCs is provided in a set of 4 dropdowns.
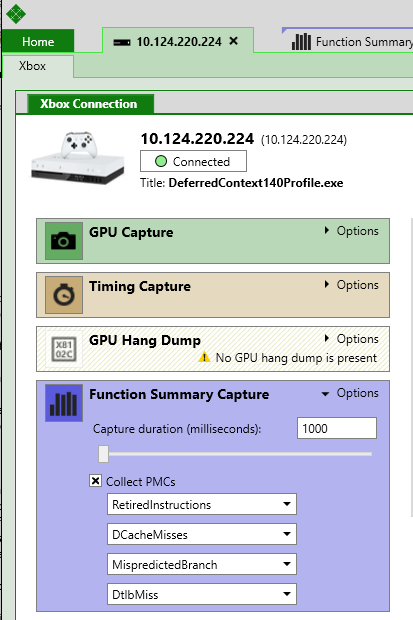
Pressing the Function Summary Capture button will cause the capture to start. The capture will complete and automatically open in PIX after the requested duration has completed.
4. Capture Summary Tab
Function Summary Captures open to a tab called a Summary Tab. This initial tab is intended to help you quickly identify the functions in your title that take the longest time to execute. A list of the 5 functions with the largest exclusive time values is provided for every thread in your title that ran title code during the capture.
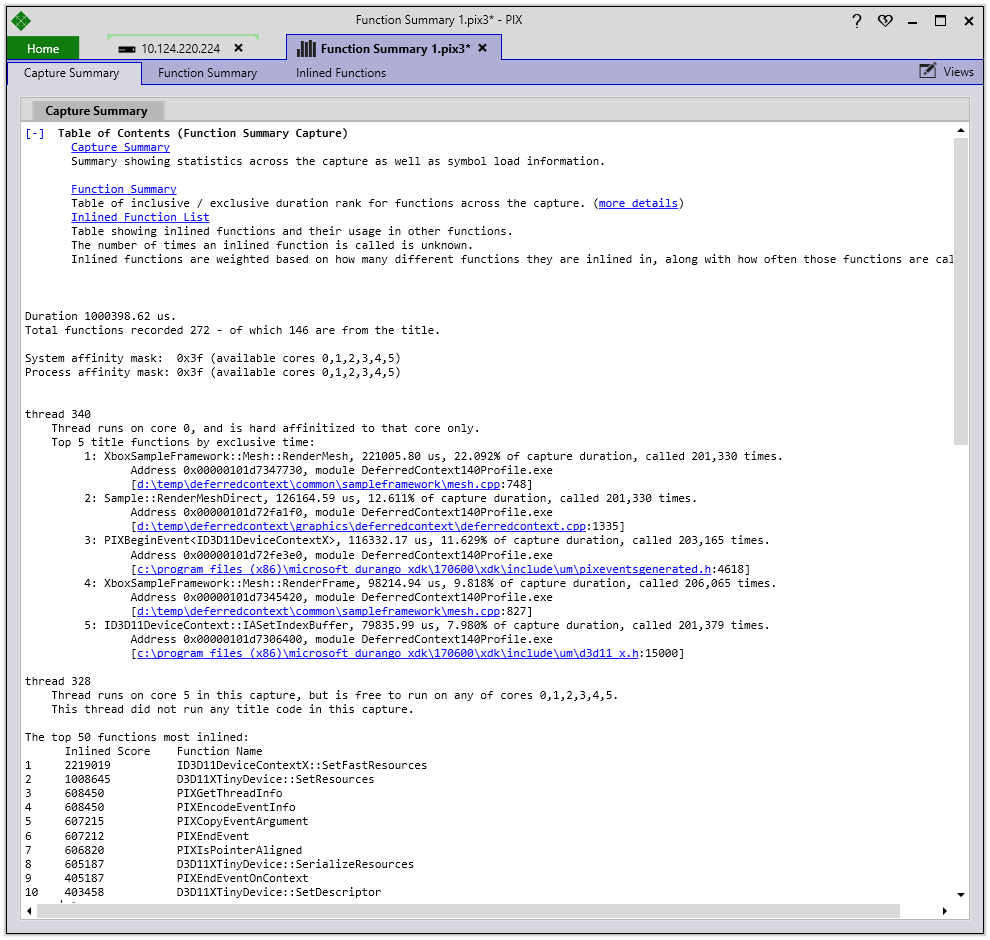
A hyperlink with source and line number information is included for each function. The source code for a function is opened in your default editor when you click the hyperlink. You can also right click on a hyperlink and select “Open in VS” to open the source in Visual Studio 2015. In addition to identifying the top 5 most expensive functions, the Summary Tab also provides information about:
- Thread Affinities. For each thread in your title, the Summary Tab will tell you the set of cores that thread is configured to run on. This information is helpful for identifying threads that you had intended to affinitize to one core, but didn’t, for example.
- Inline Functions. Function Summary captures include an analysis of the potential performance impact of the inline functions in our title. See Inlined Function Analysis in Function Summary and Callgraph Captures for more information.
5. Function Summary Tab
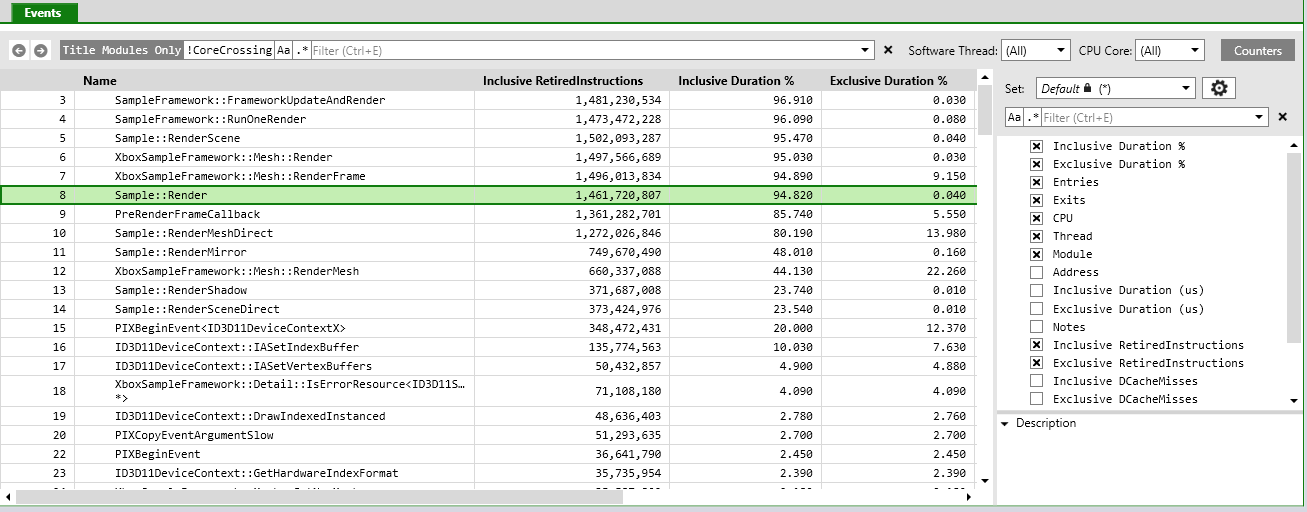
The Function Summary Tab includes an event list that contains one row for every function that was executed during the capture. The event list is typically used to sort the list of functions by a particular counter value, such as inclusive duration, exclusive duration, or PMC value.
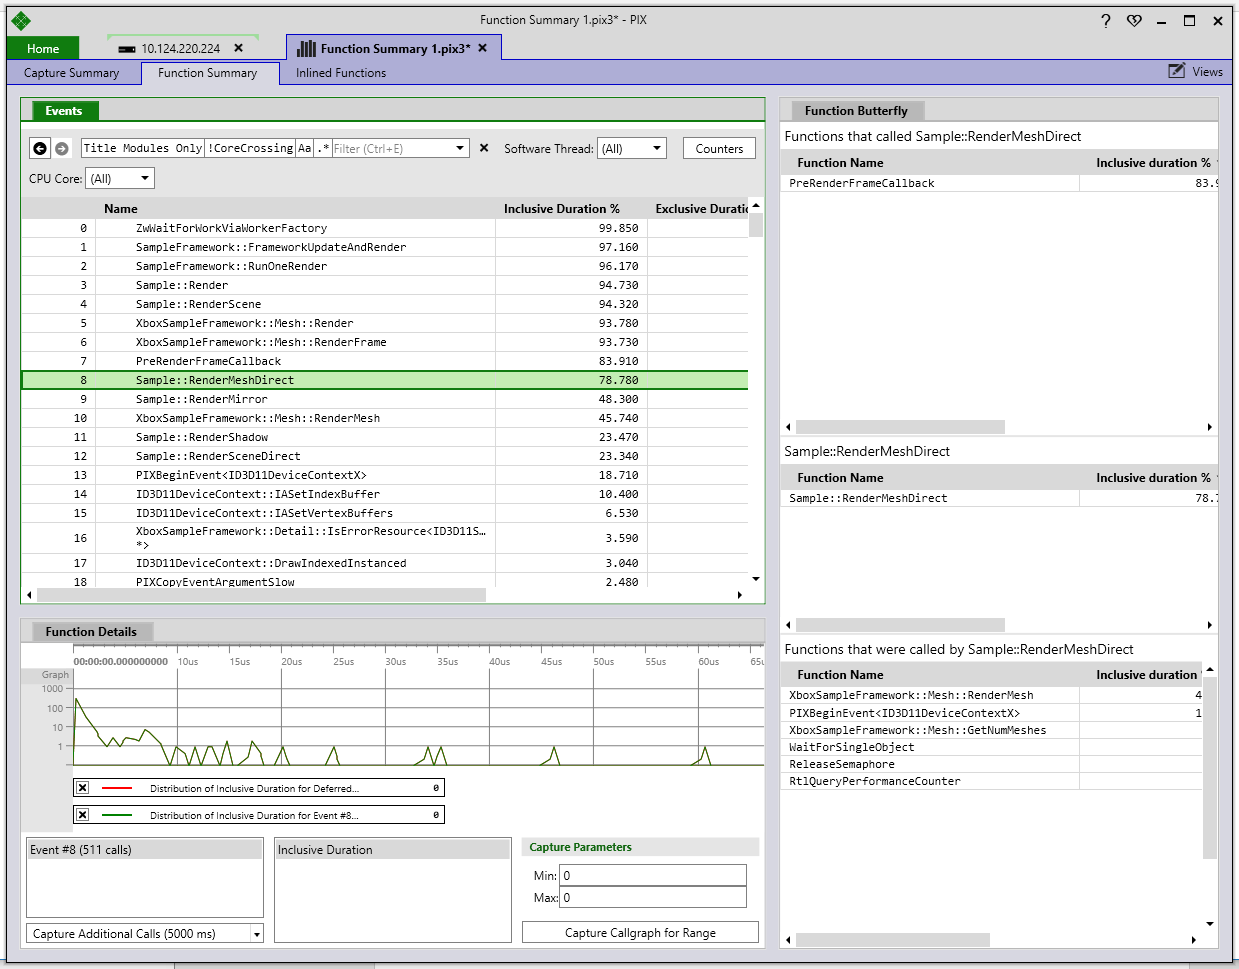
The event list has a set of columns that correspond to a set of counters that you select. Clicking on a column header will sort the list by that value.
By default, the event list includes columns for Inclusive and Exclusive duration percentages, call counts and so on. You can customize the set of columns that are displayed by selecting a set of counters from a list. Clicking the Counters button will present a list of the counters you can choose from. The set of available counters will include PMCs if you clicked the option to collect them before you started the capture.
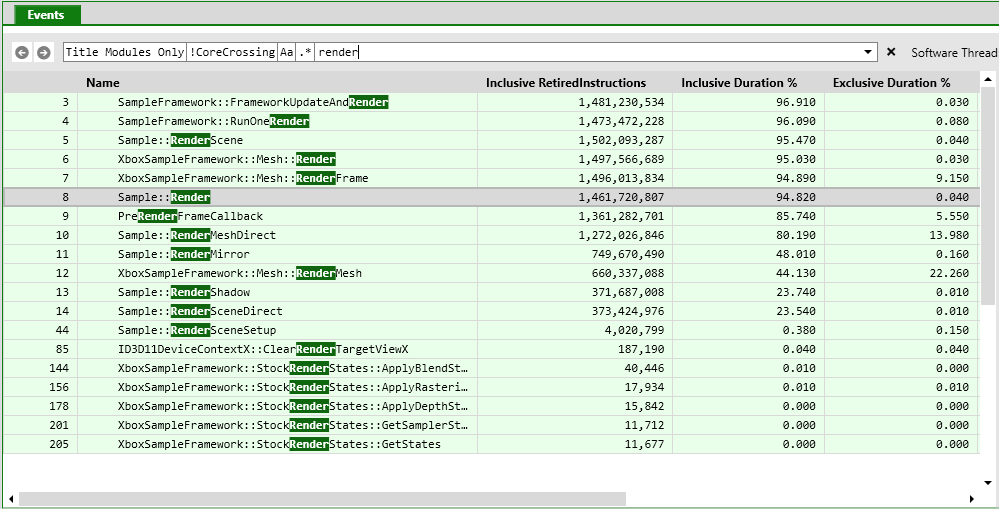
The contents of the event list can also be filtered using the filter bar display just above the list. The filter bar can be used to filter the list down to a set of functions that contain a particular string or that ran on a particular thread or core. The following example shows the event list filtered down to any function that contains the string “render”:
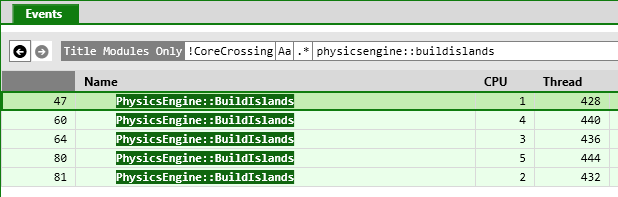
Note that the event list may contain more than one row for any given function. This will occur if the function ran on more than one thread or CPU core during the capture. PIX will show one row per function for each combination of thread and core the function ran on. The following example shows a function that ran on multiple cores and on multiple threads:
Right clicking on a row in the events list brings up a context menu that lets you perform several additional operations on the selected function.
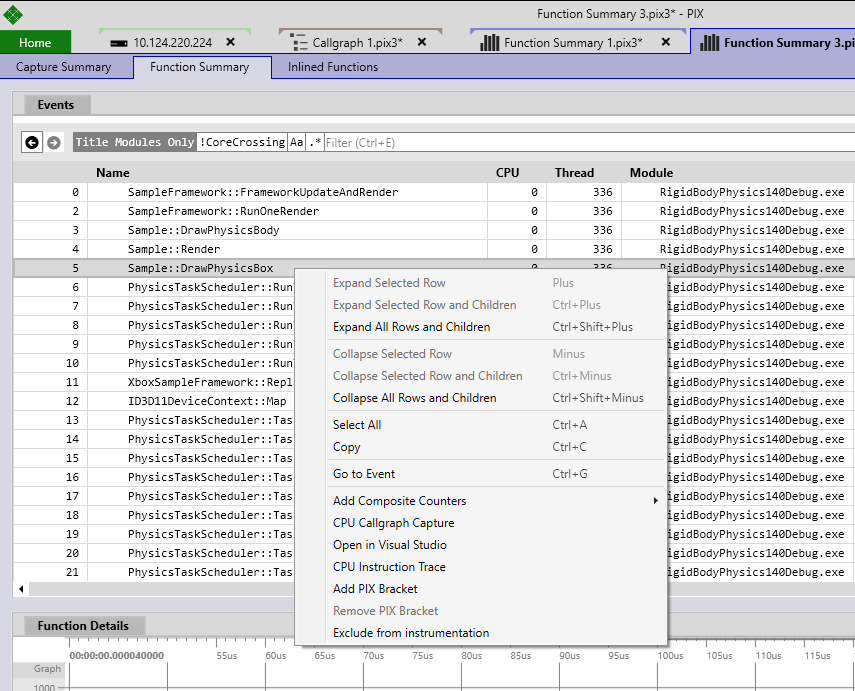
-
Composite Counters. In addition to the PMCs available natively on the console, PIX also provides a set of six Composite Counters. See Performance Monitoring Counters for more information.
-
CPU Callgraph Capture. After identifying the functions that are the most expensive in terms of time or PMC value you’ll often want to drill into the details of “why”. The next level of detail is provided by an additional capture type called a Callgraph Capture. Selecting this menu item will instruct PIX to capture the next call to the selection function on any thread or core. It will also record the entire callgraph during that function’s execution and metrics such as thread Ids, core indices, call counts, and inclusive and exclusive times. In addition, all other functions running in parallel (on different threads) are also recorded during the capture period. This provides a complete view of the activity of the title during the capture period. Be aware that it is possible to capture an infrequently executed function in a function summary capture, but when you try to do a callgraph capture, the function is not called again before the callgraph capture mechanism times out.
-
Open in Visual Studio. This menu option will open the source file containing the selected function in Visual Studio. The source file for the function will be opened directly if it is at the location specified in your title’s PDB. Otherwise, you’ll be prompted to locate the source file on your PC.
-
CPU Instruction Trace. PIX Instruction Trace captures trace the execution of every assembly instruction that is executed when the selected function runs. This level of detailed tracing is useful for drilling into performance metrics such as memory cache efficiency.
-
Add PIX Bracket. PIX timing captures display information describing when each piece of work is carried out by the CPU and GPU. There are two techniques for adding the markers that timing captures display. The PIXBeginEvent and PIXEndEvent APIs can be used to instrument your source code. As an alternative, you can dynamically add PIX events using the Add PIX Bracket menu item in Function Summary captures. Adding PIX events dynamically allows you to skip the steps required to instrument, rebuild, and re-deploy your title. Dynamic PIX events are especially useful for drilling into functions that you didn’t originally instrument with calls to PIXBeginEvent and PIXEndEvent.
-
Remove PIX Bracket. This menu item removes dynamic PIX events that were added with Add PIX Bracket.
-
Exclude from instrumentation. By default, PIX will instrument all functions in your title. The Instrumentation Exclusion List allows you to select functions to remove from future instrumentation to reduce the amount of overhead in your profiling sessions. You might choose to exclude small, frequently called functions that you have already optimized, for example.
In addition to the events list, the Function Summary Tab provides two additional views in the default layout:
-
Butterfly View. The butterfly view shows the set of callers and callees for the function that is currently selected in the events list. See the Butterfly View section for more details.
-
Function Histogram. Finding functions that usually execute in a consistent amount of time, but occasionally have an outlier in execution time, is one of the most challenging aspects of performance profiling for game developers. The Function Histogram view can help you find those functions that occasionally spike. See the Function Histogram page for more information.
6. Performance Monitoring Counters
You can choose to collect performance monitoring counters (PMCs), and which to collect, when starting a Function Summary capture. Pick any four of the CPU counters supported by the Xbox One processors. The options pane that appears when you expand the function summary capture button includes dropdowns that let you select which four counters to capture. If you don’t have a specific need to look at PMCs, skipping their collection causes the capture to run much faster and interfere with the title less.
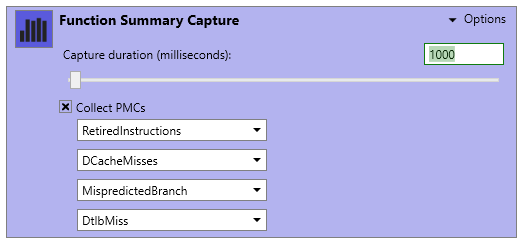
In addition to the PMCs available natively on the console, PIX also provides a set of fix Composite Counters. A composite counter is a value computed from the values of multiple built-in PMCs. These counters represent computations that are commonly done using the built-in PMCs. For example, the “Branch Instructions Per Branch Mispredict” composite counter tells you whether a given function contains branches that the branch predictor frequently mispredicts.
Composite Counters are available from the right click menu on the Function Summary tab:

The six composite counters are computed as follows:
- Clocks Per Instruction = Absolute Duration / Retired Instructions
- Instructions per Data Miss = Retired Instructions / Data Misses
- Data Miss Weighted = Data Misses^2 / Retired Instructions
- Data Miss Weighted = Data Misses^2 / Retired Instructions
- Instructions Per Branch Mispredict = Retired Instructions / Branch Mispredicts
- Branch Instructions per Branch Mispredict = Branch Instructions / Branch Mispredicts
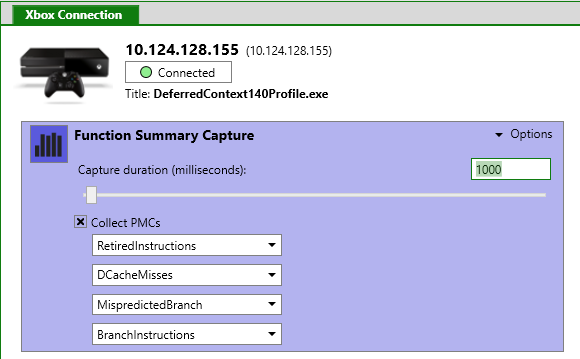
Note that for the Composite Counters to be available, you must have selected the RetiredInstructions, DCacheMisses, MispredictedBranch and BranchInstructions PMCs when your Function Summary capture was initiated:
7. Filtering
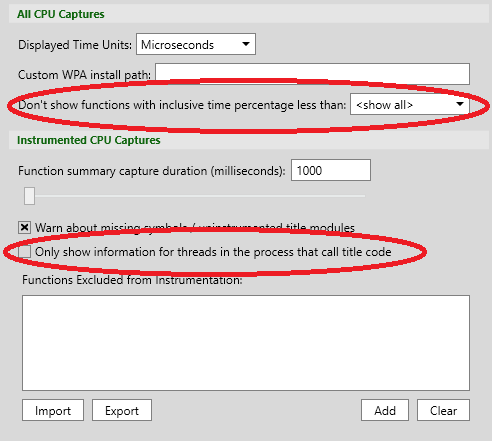
The Settings pane gives you the option to omit functions from the capture that take less than a specified percentage of time. For example, if you select a value of 5%, functions that have an Inclusive Duration % of less than 5% will not be shown in the capture. This helps you filter those functions that take a relatively small amount of time and focus on the ones you’re more likely to want to optimize. Note that even with this filter set, data for functions of all durations is still collected but the data is not shown in PIX. To skip the instrumentation and data collection of a function altogether, use the Instrumentation Exclusion List.
The Settings pane also allows you to specify that threads that don’t call any title code should not be shown in the capture. Often times there are threads in your title that call only system code. You might choose to filter out these threads further reduce noise.
8. Instrumentation Exclusion List
The Function Summary profiler in PIX instruments all title functions by default. This high level of instrumentation can create significant overhead while profiling a title, which can skew your results. Small functions that are called frequently are particularly distorted. The Instrumentation Exclusion List allows you to select functions to remove from future instrumentation to reduce the amount of overhead in your profiling sessions. Choosing to not instrument a function is useful for various scenarios, including:
- Excluding small, frequently called functions that you have already optimized.
- Excluding functions that do very little work on their own, such as platform-API wrappers or public interfaces to private functions.
Currently, only functions in title modules can be excluded from instrumentation.
8.1. Modifying the Instrumentation Exclusion List
The list of functions currently excluded is in the Settings View. From this view, you can delete individual functions from the list, clear the list, or add new functions to the list. You can also export the list of excluded functions to a text file or import such a list, to share a common exclusion list with other developers.
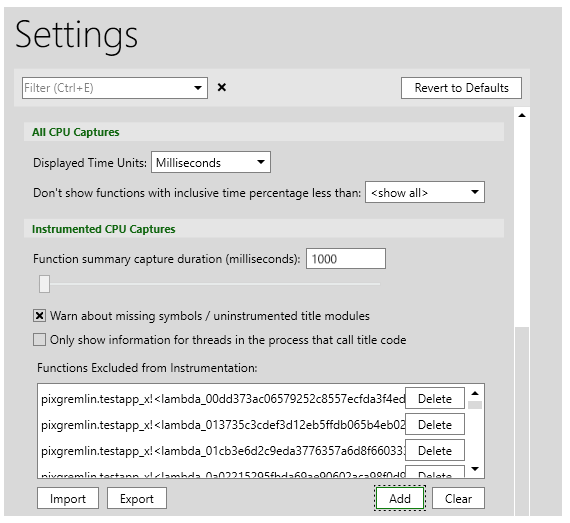
Upon clicking the Add button, an expanded Function Selector appears that allows you to select multiple functions to add to the list. Functions are filtered by the selected module, and you can use the search box and filters to easily find and filter functions.

You can also add functions to the instrumentation exclusion list from the context menu of the events lists of Function Summary and Callgraph Captures. Right click on the target function, then select Exclude from instrumentation to avoid instrumenting that function in future captures.
