PIX Callgraph Captures
Overview
Callgraph Captures provide the full callgraph for a specified function along with the callgraphs for everything that was running in parallel at the time the function was captured. A primary use of a Callgraph Capture is to find the most expensive path through the graph for your specified function. This path is known as the hot path.
Initiating a Callgraph Capture
Callgraph Captures are taken using one of the following three workflows:
- From Function Summary Captures.
- From the Callgraph button on the device connection tab.
- Progammatically using the PIXBeginCapture API. For more information see PIX Programmatic Callgraph and Instruction Trace Captures
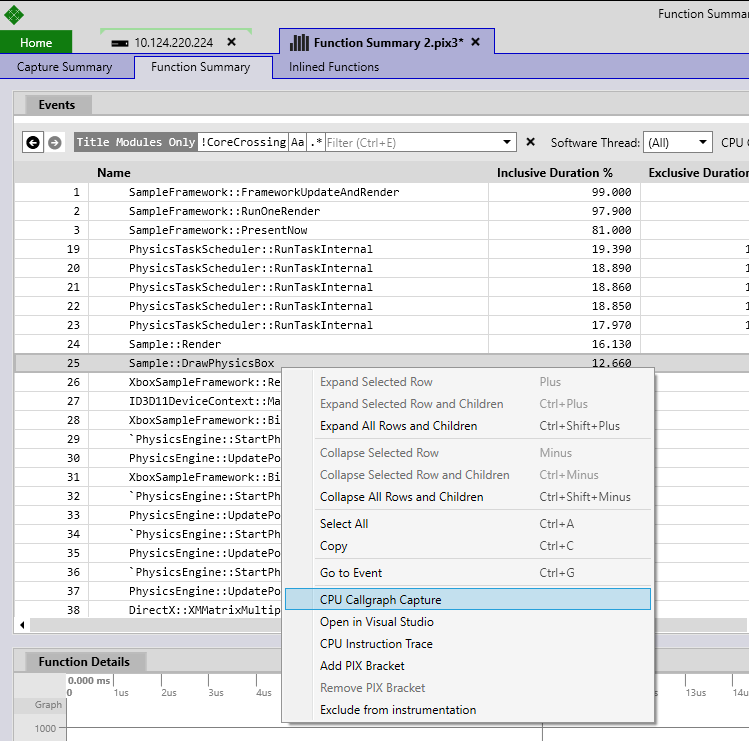
To start a Callgraph Capture from a Function Summary Capture, select the function you’d like to drill into from the event list, right click on it, and select CPU Callgraph Capture.
Figure 1. Starting a Callgraph Capture:
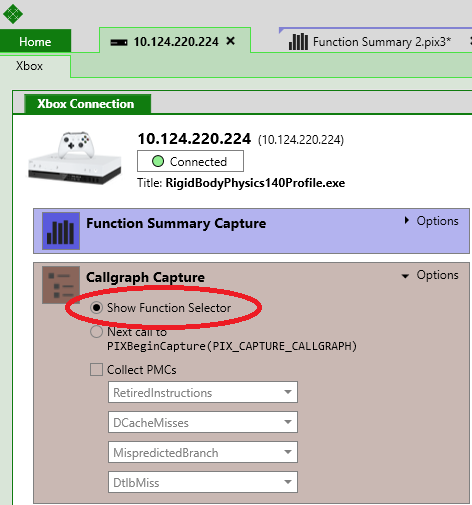
In some cases, you’ll know ahead of time which function you’d like to capture. for this case, you can specify the function directly rather than having to take a Function Summary Capture first. To directly specify a function, select the Show Function Selector option and click on the Callgraph Capture button on your device connection tab.
Figure 2. Selecting the Show Function Selector option:
A dialog will be displayed that lists the functions in your title.
Figure 3. The function selector
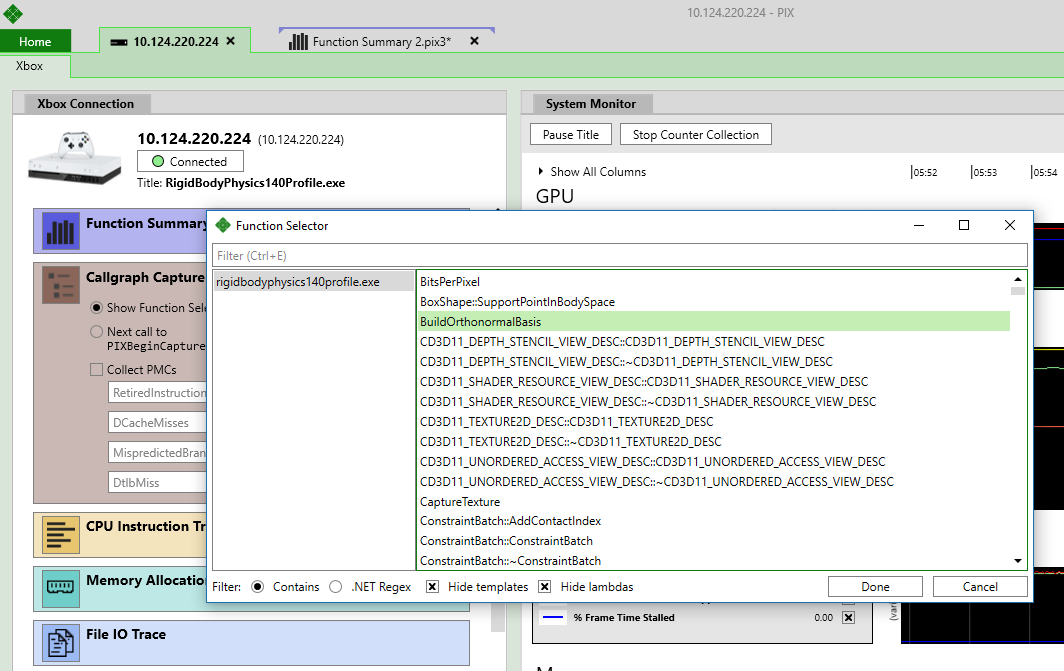
The Function Selector dialog includes a few options you can use to filter the functions shown in the dialog, allowing you to hide templates and lambdas. You can also specify a regular expression to be used when searching the contents of the dialog.
To take a Callgraph capture, find the function you’re interested in, select it, and choose Done.
After the capture starts, PIX will monitor your title, watching for the first time the function you specified is called. If the function is called within a default amount of time, PIX will capture it’s callgraph and open the capture. If the function is not called, you’ll see a timeout error.
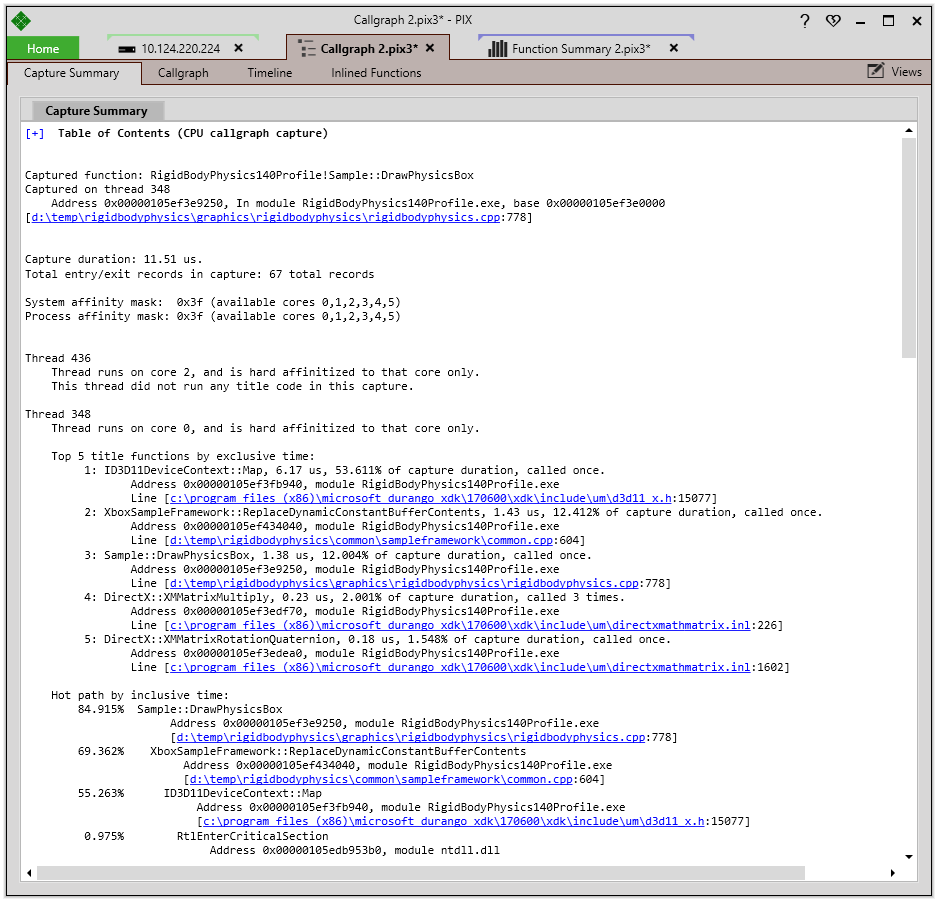
Callgraph Captures open to a tab called a Summary Tab. This initial tab is intended to help you quickly identify the most expensive functions in your capture as well as the hot path through the callgraph.
As with the Summary Tab shown for Function Summary captures, the Summary Tab for Callgraph captures includes hyperlinks for source locations as well as information about thread affinities and inline functions.
Figure 4. The Capture Summary tab:
Callgraph Tab
The events list on the Callgraph tab contains one top level row for the function you captured and one top level row for any other functions that were executing in parallel with the function you captured. In this example, PIX captured the callstacks for 5 functions that were running at the same time as the captured function (Sample::DrawPhysicsBox in this case).
Figure 5. The Callgraph Tab:
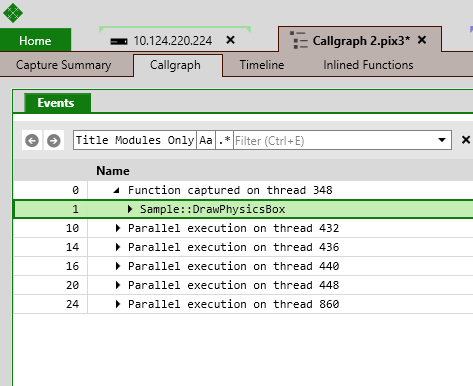
Each row in the event list (other than leaf nodes) can be expanded and collapsed to drill into the call tree.
As with the event lists for other CPU capture types, you can customize which columns are displayed by choosing a set of Counters, sort by any column, and filter the contents of the event list using the filter bar.
If you start a Callgraph capture from a Function Summary capture for which you’ve specified that PMCs should be collected, the same set of PMCs will also be collected for your callgraph capture. The list of PMCs that were collected show up as Counters that you can add to the events list.
Figure 6. The events list:
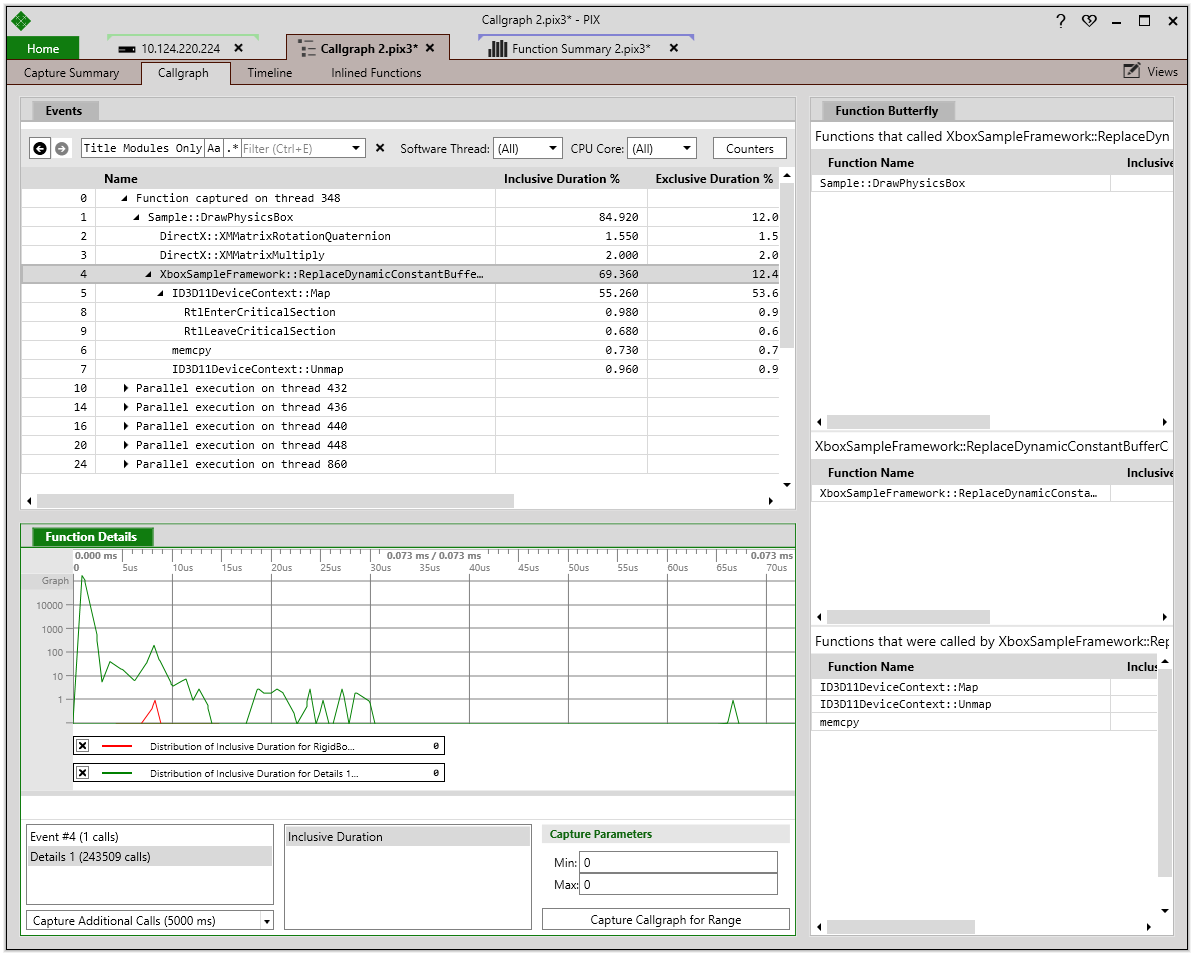
Right clicking on a row in the events list brings up a context menu that lets you perform several additional operations on the selected function.
Figure 7. Displaying the context menu of a function:
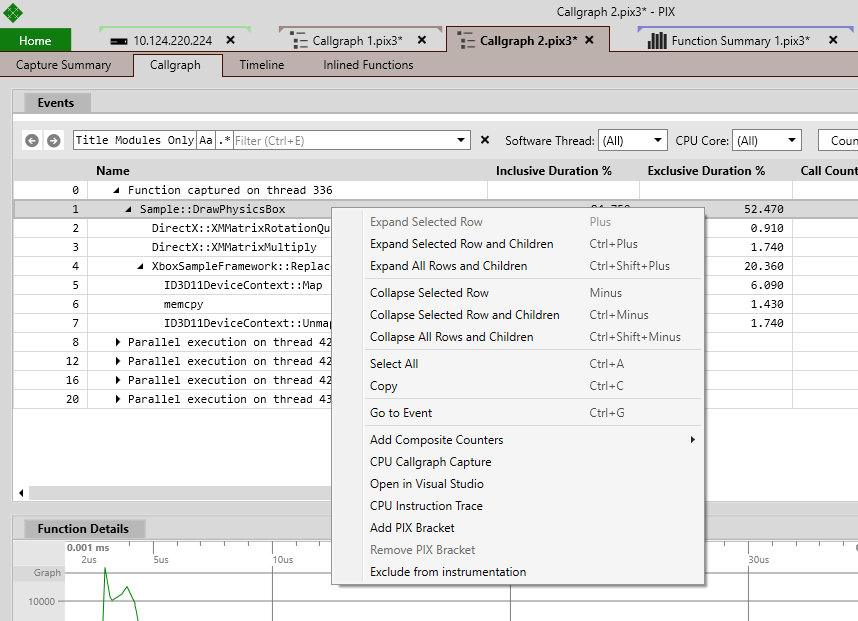
- Add Composite Counters - In addition to the PMCs available natively on the console, PIX also provides a set of six Composite Counters. See the Performance Monitoring Counters on the Function Summary documentation page for more information.
- CPU Callgraph Capture - Selecting this menu item will instruct PIX to the callgraph for the next call to the function identified by this row in the events list.
- Open in Visual Studio - This menu option will open the source file containing the selected function in Visual Studio. The source file for the function will be opened directly if it is at the location specified in your title’s PDB. Otherwise, you’ll be prompted to locate the source file on your PC.
- CPU Instruction Trace - PIX Instruction Trace captures trace the execution of every assembly instruction that is executed when the selected function runs. This level of detailed tracing is useful for drilling into performance metrics such as memory cache efficiency.
- Add PIX Bracket - PIX timing captures display information describing when each piece of work is carried out by the CPU and GPU. There are two techniques for adding the markers that timing captures display. The PIXBeginEvent and PIXEndEvent APIs can be used to instrument your source code. As an alternative, you can dynamically add PIX events using the Add PIX Bracket menu item in Function Summary and Callgraph captures. Adding PIX events dynamically allows you to skip the steps required to instrument, rebuild, and re-deploy your title. Dynamic PIX events are especially useful for drilling into functions that you didn’t originally instrument with calls to PIXBeginEvent and PIXEndEvent.
- Remove PIX Bracket - This menu item removes dynamic PIX events that were added with Add PIX Bracket.
- Exclude from instrumentation - By default, PIX will instrument all functions in your title. The Instrumentation Exclusion List allows you to select functions to remove from future instrumentation to reduce the amount of overhead in your profiling sessions. You might choose to exclude small, frequently called functions that you have already optimized, for example. See the Instrumentation Exclusion List section on the Function Summary capture documentation page for more information.
In addition to the events list, the Callgraph tab provides two additional views in the default layout:
- Butterfly View - The butterfly view shows the set of callers and callees for the function that is currently selected in the events list. See the Butterfly View section for more details.
- Function Histogram - The Function Histogram view can help you find functions that usually execute in a consistent amount of time, but occasionally have an outlier in execution time. See the Function Histogram page for more information.
Timeline Tab
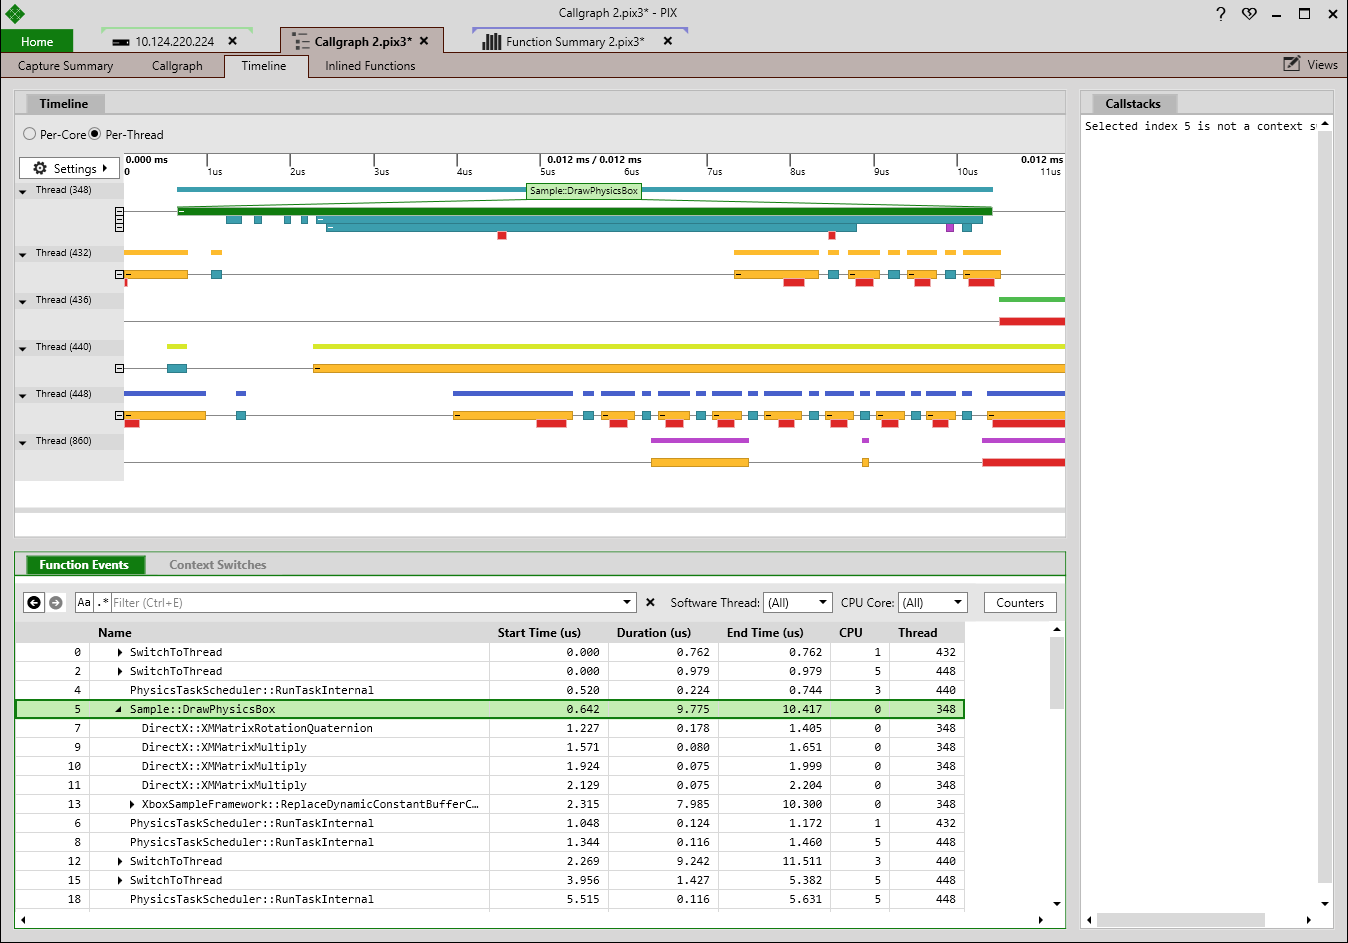
The Timeline tab contains the same callgraph information as the event list on the Callgraph tab, but lays it out visually on a timeline. The timeline contains one lane for each thread (or core) that ran code during the capture. The timeline control in the Timeline tab is the same control used in Timing Captures. Features from the Timing Capture timeline such as the ability to pivot the data per-thread or per-core, selection synchronization between the timeline and an event list, and the display of callstacks on context switches are all provided in the Callgraph timeline.
Displaying the callgraph data on a timeline makes it easier to see how long each function in the callgraph takes to execute relative to others. It’s also helpful for seeing which functions are running in parallel with other functions, as well as when and why threads are scheduled in and out. When a context switch is selected in the timeline, PIX will show you the callstack for the threads that are switching in and out, along with any readying thread information.
Inlined Function Tab
Callgraph captures include an analysis of the inlined functions in a capture that are most likely to impact your title’s performance. See Inline Function Analysis for more information.
See also
Using PIX for general title performance