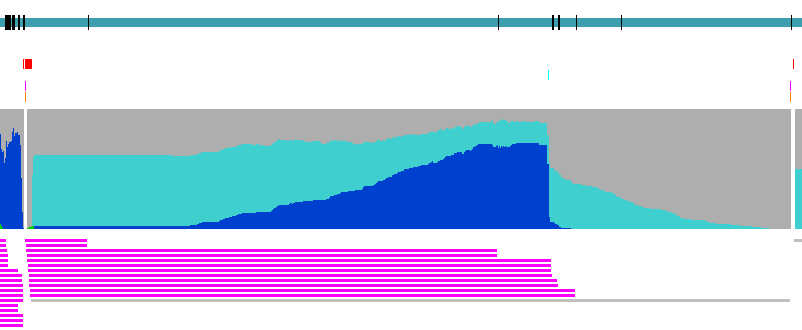
PIX Shader Timelines
In addition to the Context Rolls and Analysis Measured Duration timelines, the following timelines have been added. All these timelines are derived from the Command Processor and Sequencer blocks.
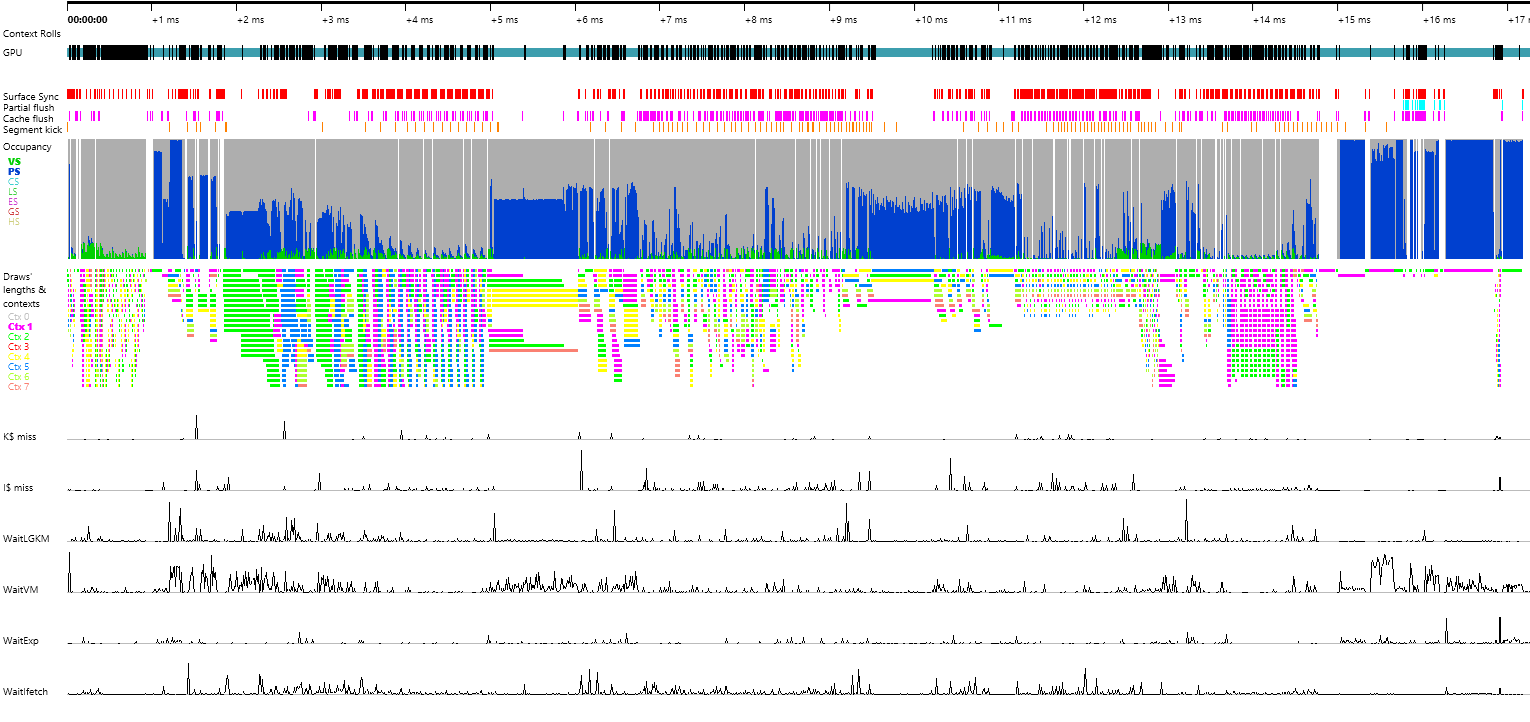
- Surface sync
- Partial flush
- Cache flush
- Segment kick
- Occupancy
- Draws lengths and contexts
- Performance counters
- Examples
Surface sync
A surface sync event happens when the command processor receives confirmation that a relevant surface is coherent with memory. Surface syncs are expensive, and could be taking from a hundred to a thousand cycles. In most situations, a surface sync also means a context roll. Surface sync events are:
- Wait for a previous graphics contexts that touch the given surface to stop.
- Flush various caches.
- Write-back the caches.
- Ask the PFP to wait for the ME to complete the flush.
Each tick on the timeline represents a surface sync event.
Partial flush
A partial flush is a barrier which makes the dispatch of waves of a certain type to block until all work downstream from the VS, PS or CS is done.
Each tick on the timeline represents a vertex shader, pixel shader or compute shader partial flush event.
Cache flush
There are multiple caches on the GPU and a cache flush event happens when a flush or a flush / invalidate of a cache is completed.
Each tick on the timeline represents any flush/invalidate event.
Segment kick
This event is displayed when a segment of the command buffer is submitted to the GPU.
PIX handles most command buffer segment kickoffs with a GPU flush. This is different from the runtime. If you have many segment kickoffs in the capture, then timing results and trace results might be inflated.
Each tick on the timeline represents a submission of a command buffer.
Occupancy
This shows a colour coded graph of what wave types are active at any given time for a sequence of draw calls. Selecting a draw call highlights waves belonging to that draw call.
Wave front graph represents how many and what types of waves are running.
Draws lengths and contexts
This shows when each draw call is started and ended and what graphics context it was executed on. Each bar represents one draw call and its colour represents a graphcis context index.
Each bar on the timeline represents a draw call start to finish, and colour represents a context index.
Performance counters
Shows a graph displaying a snapshot of some of the performance counters.
The graphs represent instantaneous readings of the performance counters.
Examples
The following examples show some of the problems that the timelines are designed to expose.
Detecting Command Processor stalls
Sometimes it is unclear why the pipelined timer take so much longer than the serialized timer; for example see the numbers below. First, it’s improbable that 25 waves took 0.637ms and second, the serialized 100 Mhz clock shows a number that is several magnitudes lower than the pipelined timer.
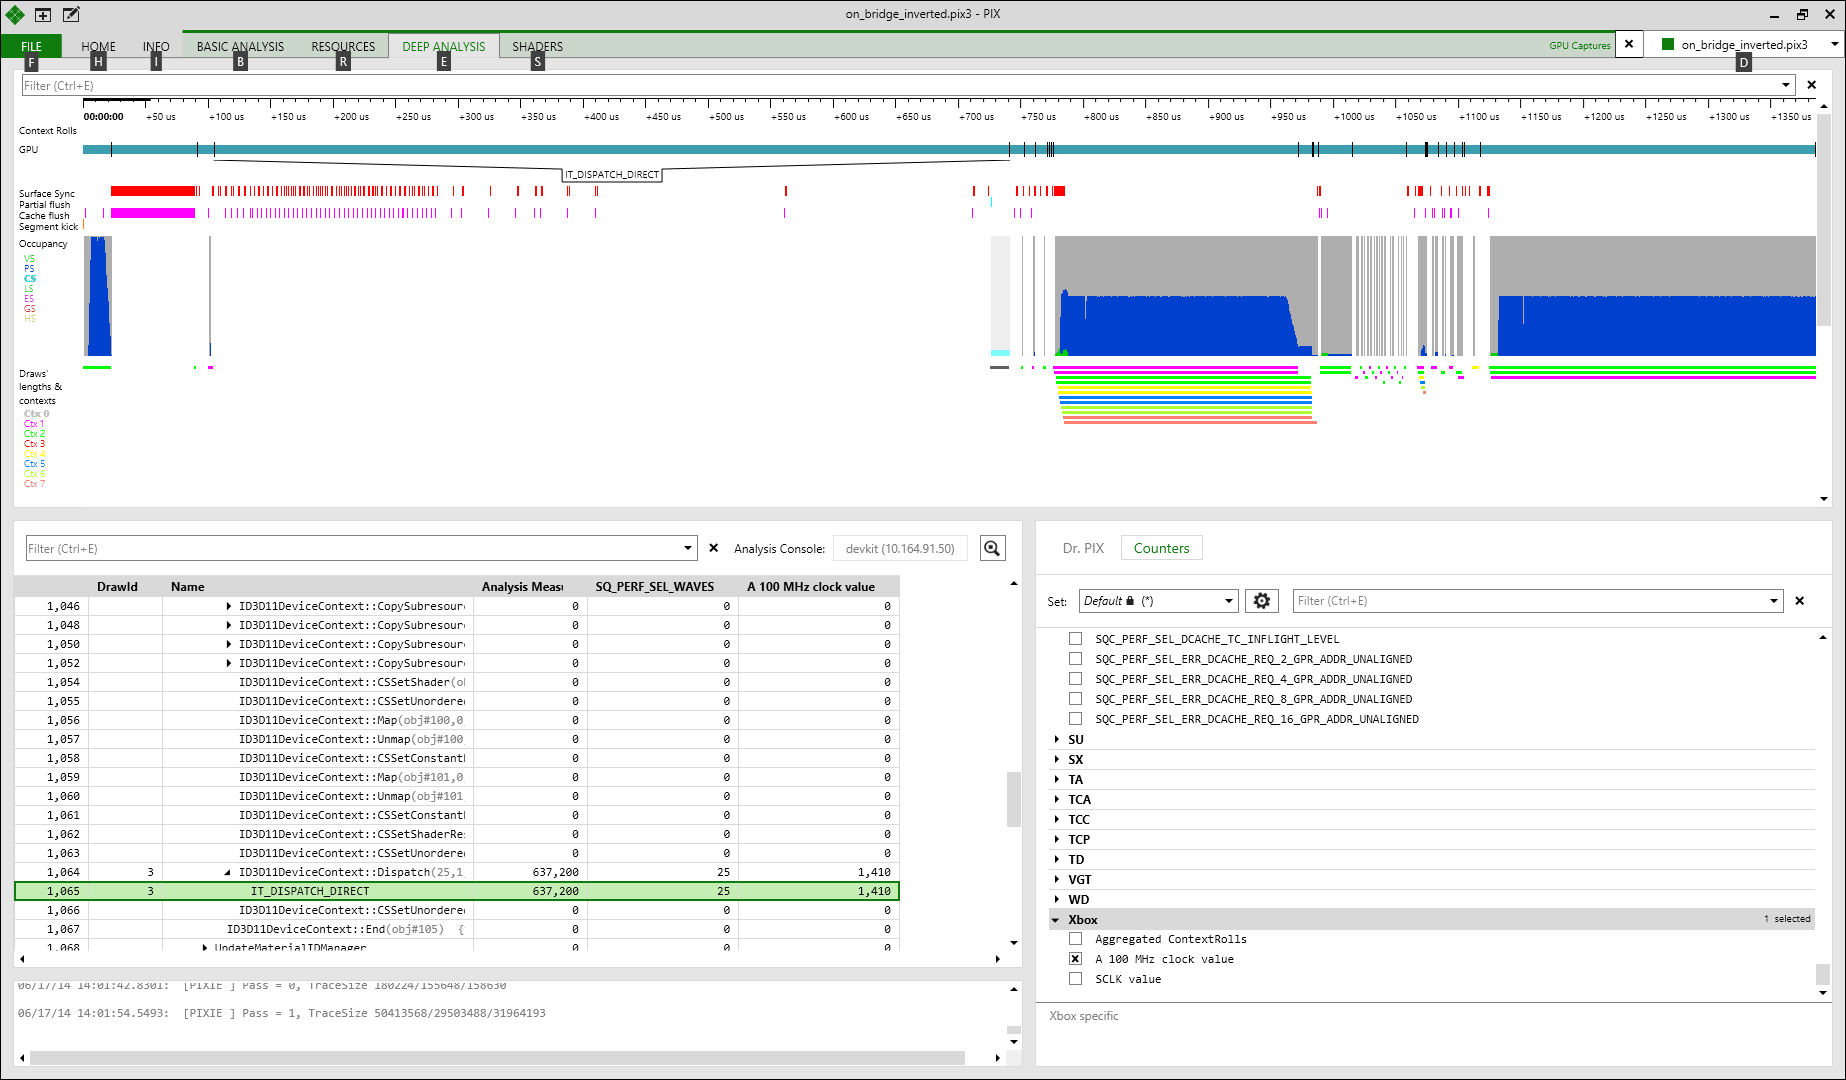
According to the Analysis Measured Duration timer (pipelined timer), there is a 0.637ms dispatch, and the actual duration of the dispatch is 0.0141 ms (according to the serialized timer.) The new views reveal that most of that time is consumed by synchronization on the command processor to deal with CopyResource and other similar functions (seen before the Dispatch call in the grid view).
Context rolls and draws overlap
Each graphics context is color coded and length of each draw is visible so it’s possible to see at a glance whether a context roll poses a problem. Analysis Measured Duration timeline only shows ends of draw calls, so in order to find which draws are overlapped, one previously needed to compare pipelined and serialized timer counters. With the new view it’s possible to see when a context rolls and how much it’s affecting performance.
Context rolls introduce a delay in draw call dispatch, but in many cases that delay doesn’t matter because the GPU can’t run more work anyway.
For example, in the image below, the context roll is infrequent and many draw calls overlap. When there is a roll, the GPU has many draw calls in flight at the same time anyway, so optimizing for context rolls here doesn’t make any sense.
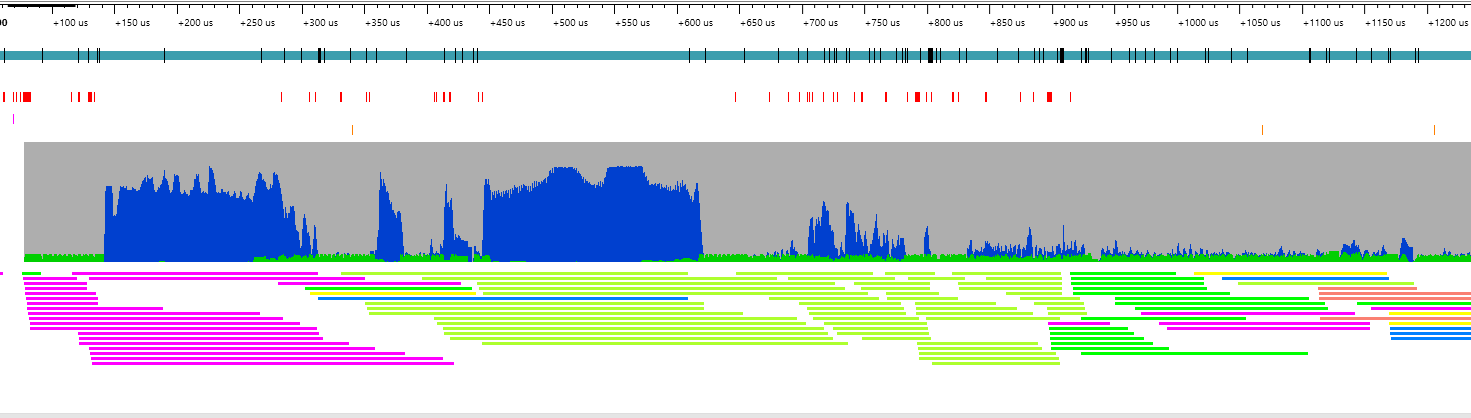
Compare it with the following image where there are many context rolls.
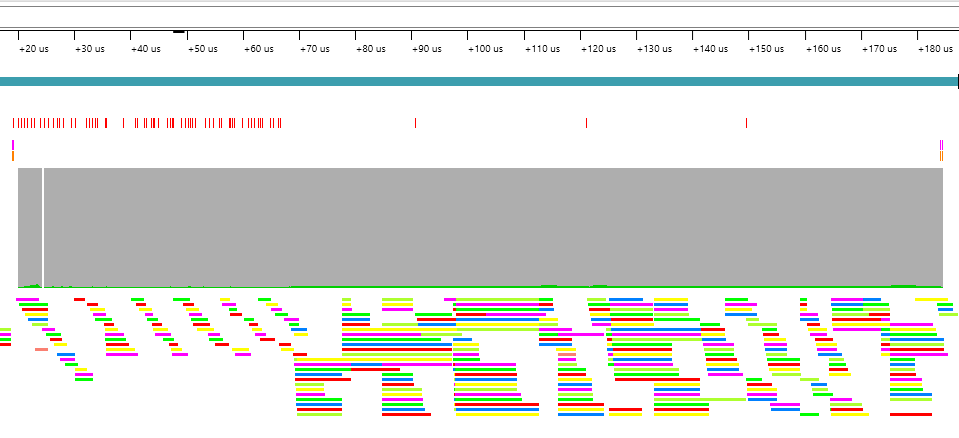
The display of the draw calls stacks them up until it runs out of screenspace, then it wraps around. If draw calls are separated by more than 5000 cycles of GPU work, they can be displayed on the same lane as the previous draw.
In the above image, especially in the left part of it, draws take so little time there is more empty space than coloured bars. This is a case where eliminating context rolls would be beneficial for performance.
Shader work overlap
One of the questions when using Asynchronous Compute to help out graphics is how to synchronize async compute to the graphics timeline. Turns out that in many cases it’s possible to synchronously overlap CS work with some types of graphics work just by issuing a Dispatch at the right time.
For example, the following image shows a number of draw calls followed by a compute shader based copy.