Analyzing PIX Data
Use PIX to analyze draw calls.
Analyzing PIX Data
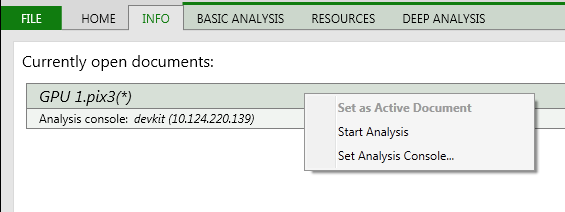
To analyze PIX data for draw calls, under the Info tab, right-click the capture name and select Start Analysis. This transfers more data over from the console, and can take a minute or so to complete.
Figure 1. Start Analysis:
Any item that appears in the UI with a triangle preceding it can be expanded by clicking on the triangle.
Figure 2. Expand a frame to display a list of all the events that occurred as part of the frame:

All the draw events are shown in the Events window. When you click a draw event, the entry is highlighted, and the entries for Resources change - including (by selecting a Render Target) the screen image after the draw event selected has completed, and similarly the Depth buffer, the Stencil buffer, the GPU state, and the shader code and disassemblies.
Figure 3. The first draw call from a captured frame from the Deferred Particles sample. Use the mouse wheel to scale the render image. Note the selection of GpuWorkEvents in the Filter, to reduce the entries in the Event List:
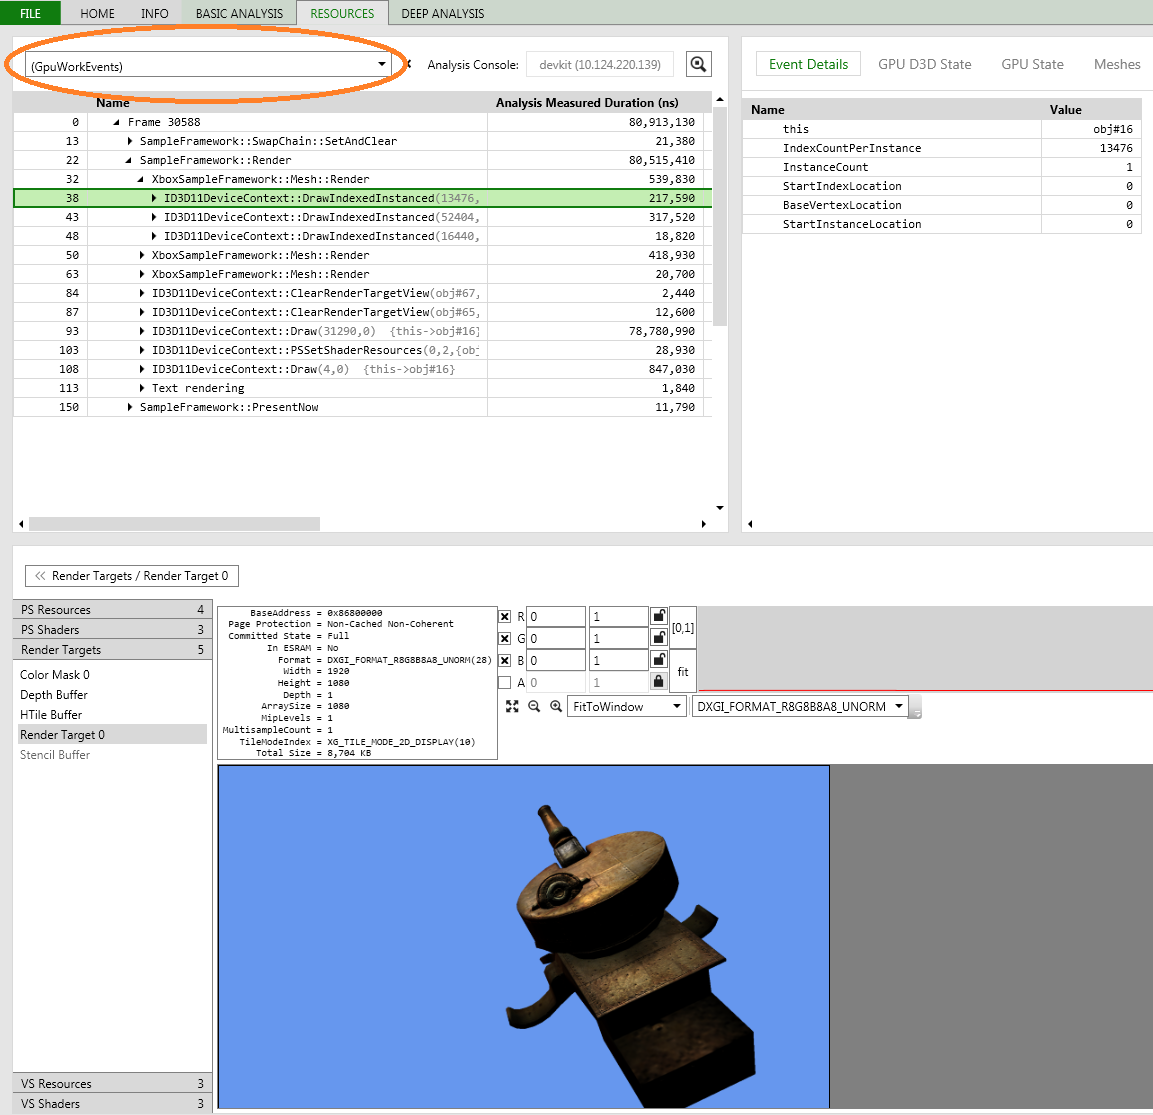
Figure 4. The second draw call from the same frame:
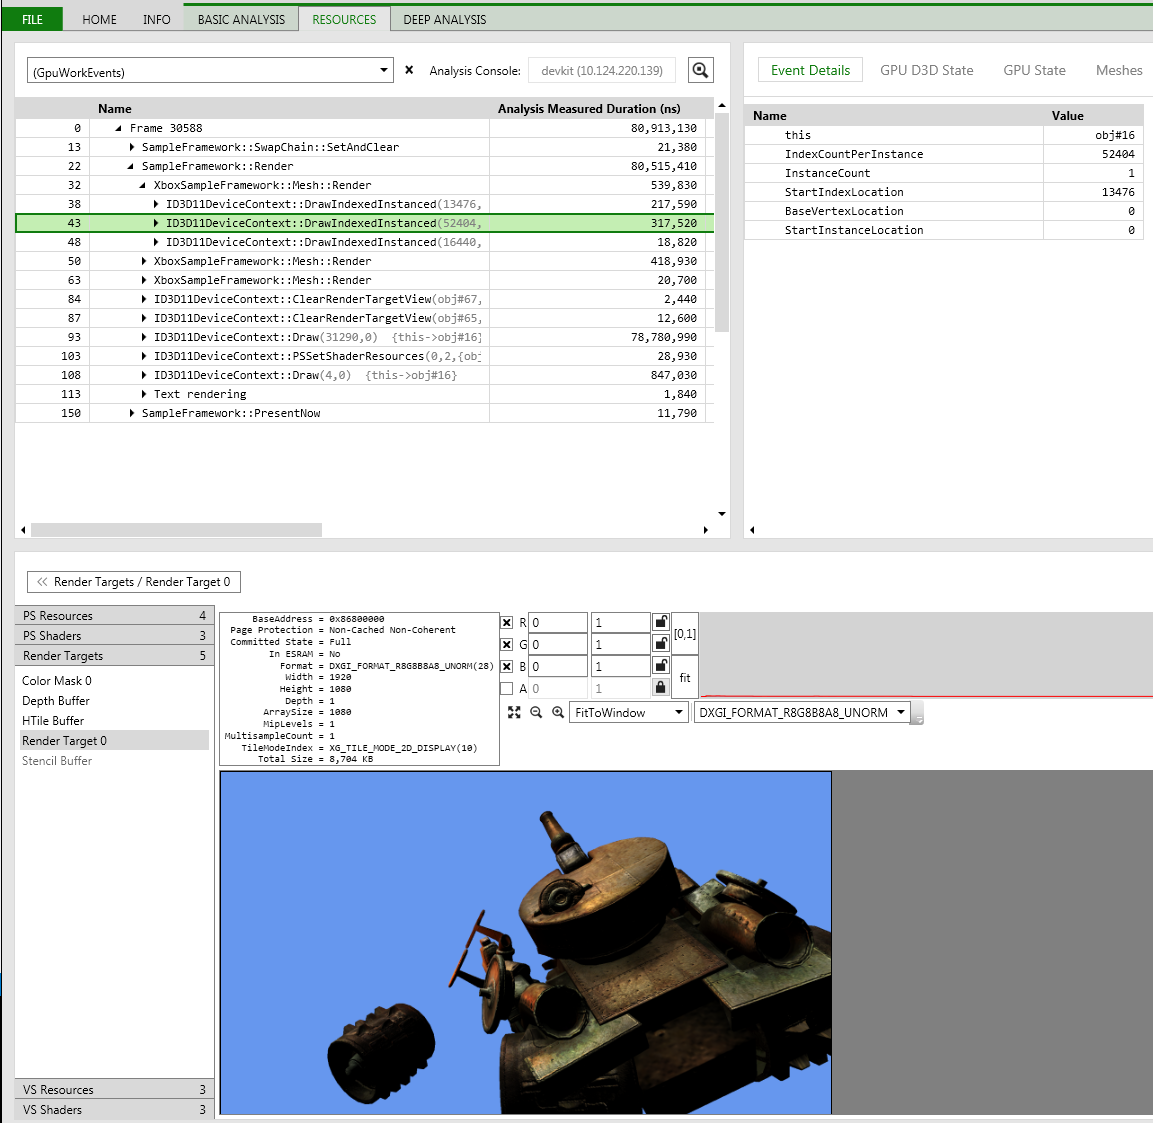
Figure 5. The third draw call from the same frame:
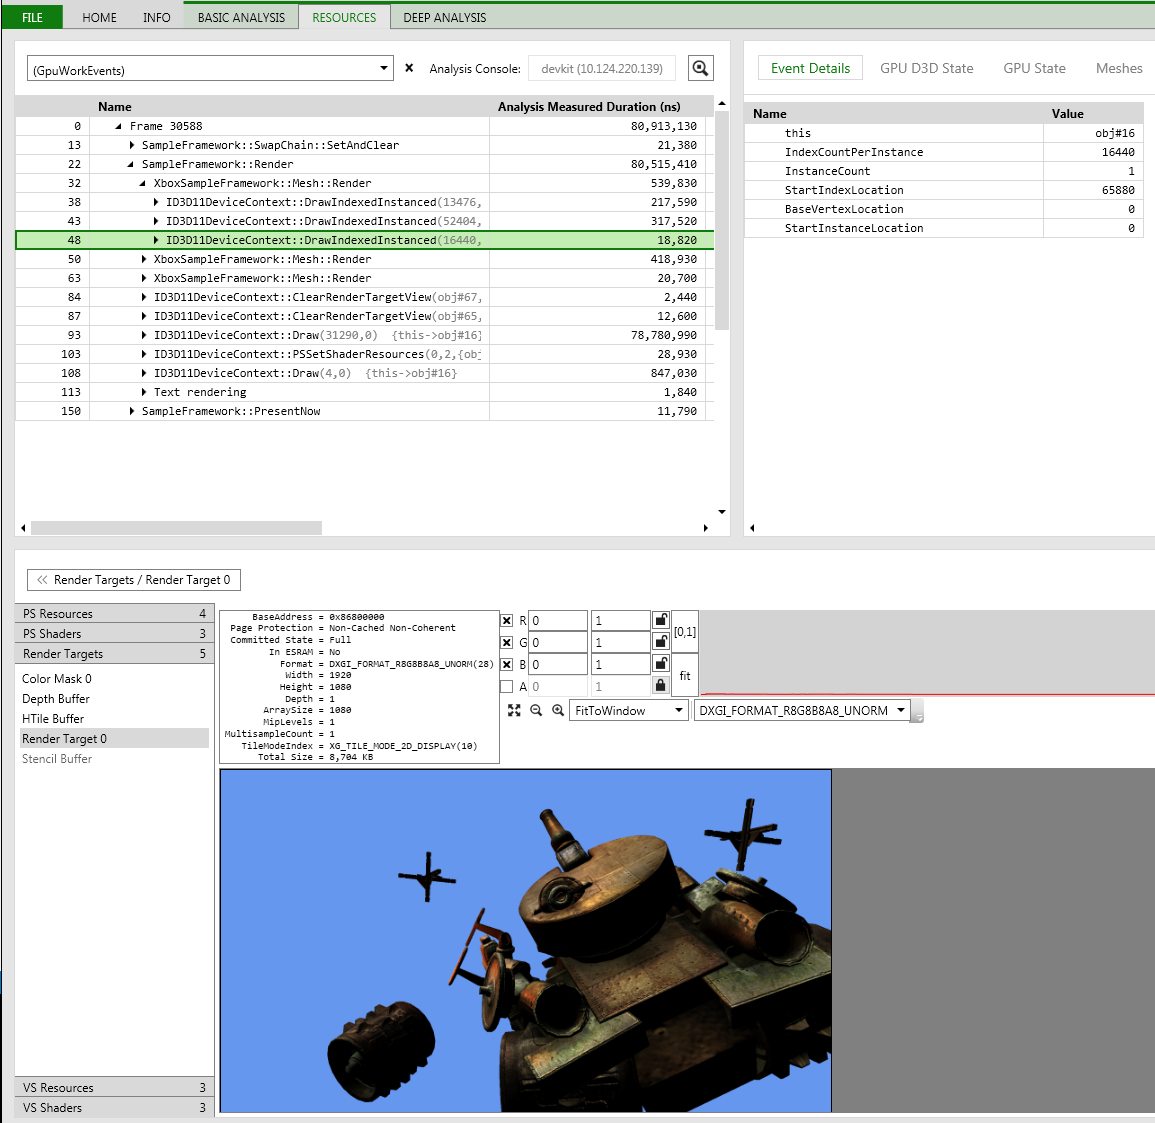
Figure 6. The fourth draw call from the same frame. Placing the mouse pointer on the image will display the X and Y co-ordinate, and the RGBA value for that point, above the image:
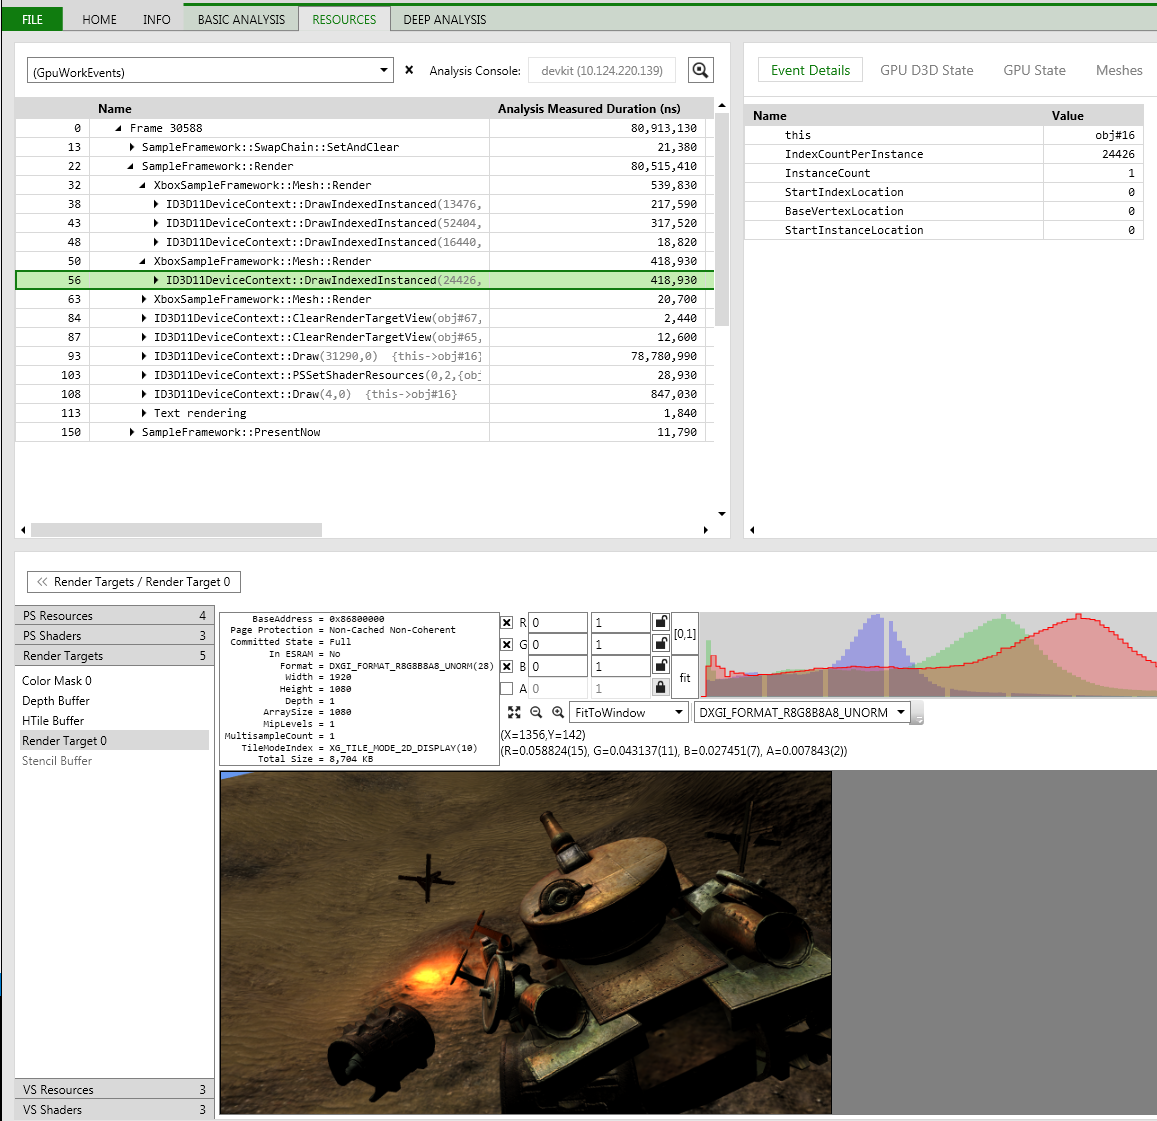
Figure 7. The final 3D draw call from the same frame. Only the text has still to be rendered:
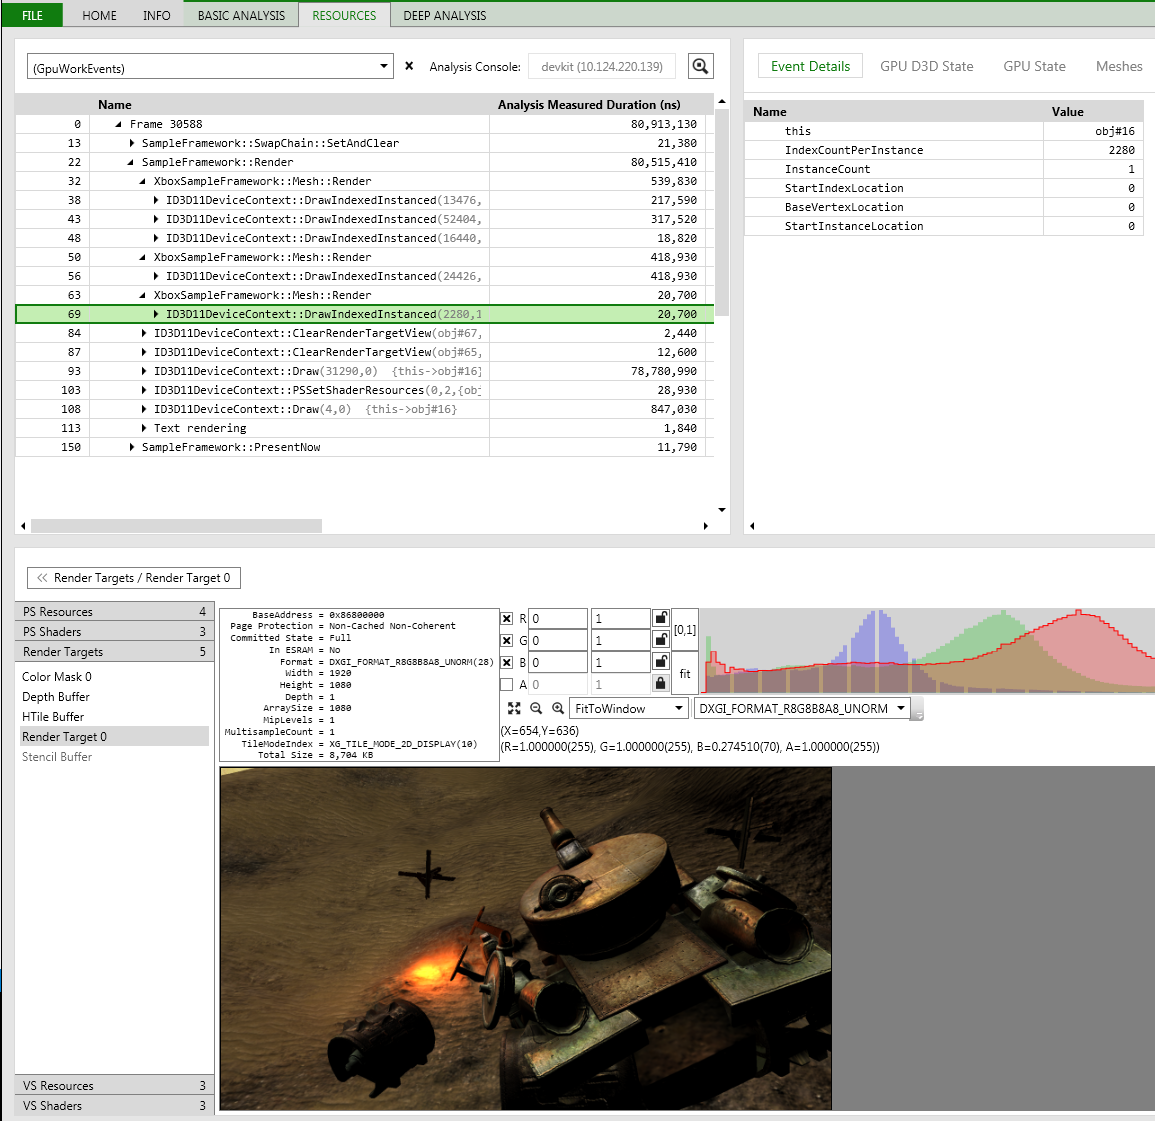
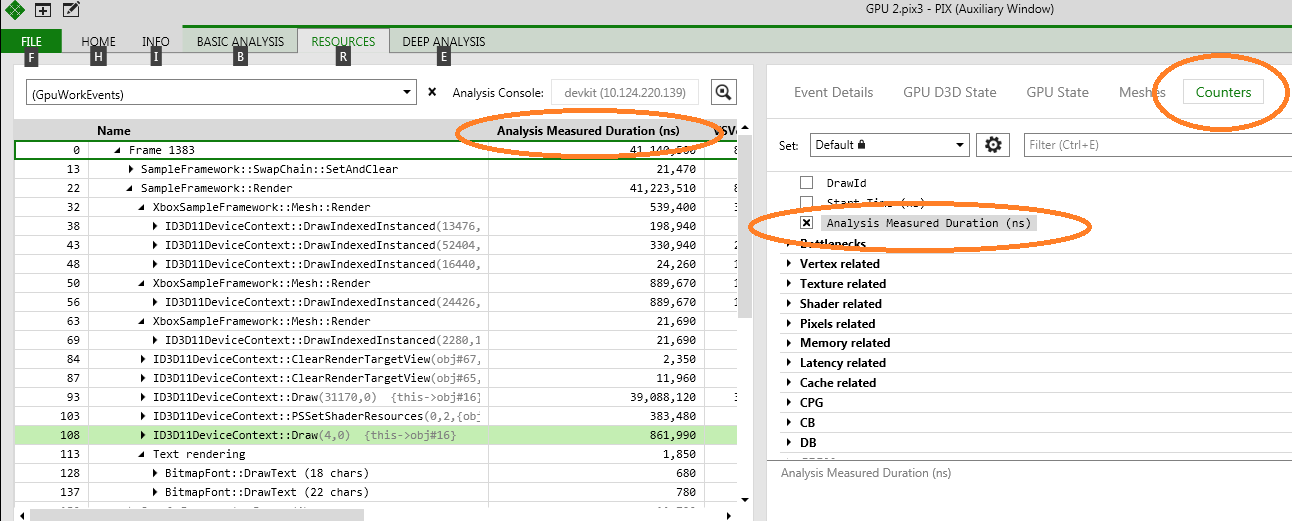
Figure 8. To get the time in nano-seconds for the draw calls, select Analysis Measured Duration (ns):
Note
To copy a row of the Event list, highlight the row then select Ctrl-C. This row of data can then be pasted into another app, such as Excel.
To copy a number of rows, hold down the Ctrl and Shift keys, and use the up or down arrow to highlight a range of rows. Then select Ctrl-C, and then paste the range into another tool.
The Timeline
Select the Deep Analysis tab, then selecting an event in the events list will highlight that event in the timeline.
Figure 9. The Context Rolls heat map identifies hotspots of context roll activity:
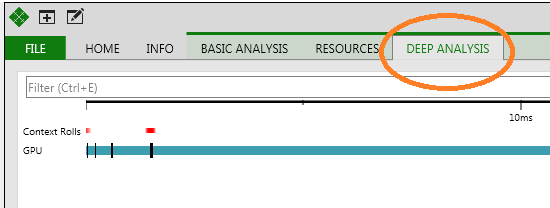
If you see a lot of context rolls due to shader changes, inspect the __XBOX_PRESERVE_ALL_INPUTS flag (in Shaders and the FXC Shader Compiler). This flag can be used to have the shader compiler attempt to preserve all inputs to the pixel shader, which can be used to force pixel shaders to have the same input signature and thereby avoid provoking driver context rolls.
Figure 10. Right-clicking on the event name in the timeline highlights a number of areas of the event to focus on:
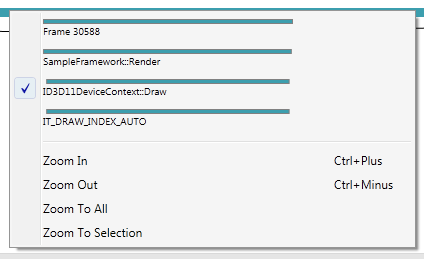
The content of the timeline will change to CPU activity if a frame is captured. The Software Thread entry shows the identifiers assigned by the system during runtime. These will change from run to run, but the one benefit is that you can use the thread IDs to match threads that show in timing captures with threads that show in the ETL captures that are loaded in WPA.
Counter Aggregation
When calculating derived and hardware GPU counters for single draw calls, PIX idles the GPU pipeline between every GPU work event in the capture. This allows you to evaluate the performance of individual GPU work events in isolation and relative to other events across the frame. One draw’s measurements may spike unexpectedly over other draws in the scene, leading you to discover a problem with the shaders or resources used on that particular draw.
When evaluating the performance of an entire frame, or of subsystems such as the shadow pass or post-process rendering phase, these calculations artificially introduce a deviation from the real performance of your title. Good title code will rarely idle the pipeline between events and instead benefits from parallelism as events enter and exit the pipeline. For this reason, PIX analysis calculates and displays derived and hardware GPU counters at each level of the PIX event hierarchy as a single sequence of events. This allows you to more closely map performance measurements to the actual performance of your frame or of subsystems which should map to your PIX event hierarchy.
The results are displayed in the PIX Events view. Leaf node events show the results of a single work event in isolation, with no artificially introduced pipeline idling. Parent node events show the results of all child events calculated as a continuous sequence, with no pipeline idling in between the events. A side effect of this is that counter values shown for parent events can and will often be larger or smaller than the sum of the child events.
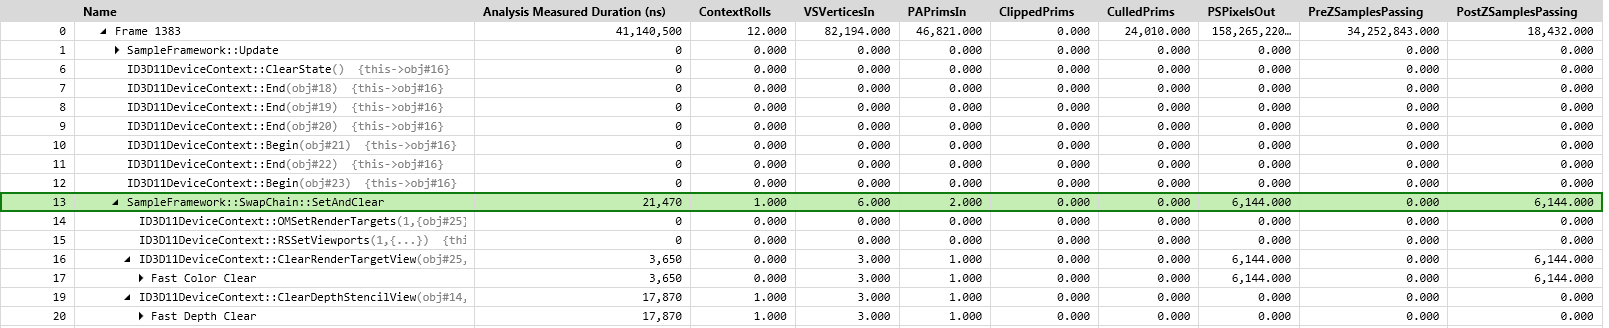
For example, in the image below, from a PIX GPU capture of the Bokeh sample, you can see the Analysis Measured Duration for event 27 to event 209. This has a series of individual values whose sum total is 10313320. The parent event 21 has the Analysis Measured Duration value 10623340. In this case, this represents a slight increase in total duration when all of the draws in the Render bracket are played consecutively as opposed to individually. This increase is due to interactions between overlapping draw calls.
Figure 11. Event 13 is the parent event for events 14 to 20:
Analysis Measured Duration Aggregation
Analysis Measured Duration is calculated similarly to other counters, but timing data is collected from bottom-of-pipe timestamps that are provided, similar to D3D11_QUERY_TIMESTAMP queries that you might collect in game code. Because only bottom-of-pipe data is collected for Analysis Measured Duration and the pipeline is not idled between events, it is possible for a sequence of overlapping events to return values smaller than expected or at zero.