PIX System Monitor
The PIX System Monitor provides real-time continuous capture of performance data when an app is running in the game partition on Xbox One.
Setup
The System Monitor opens up for the default console on start-up.
Figure 1. The default view graphs CPU usage. Drag the mouse alongside the Y scale of the graph, to increase and decrease the scale.
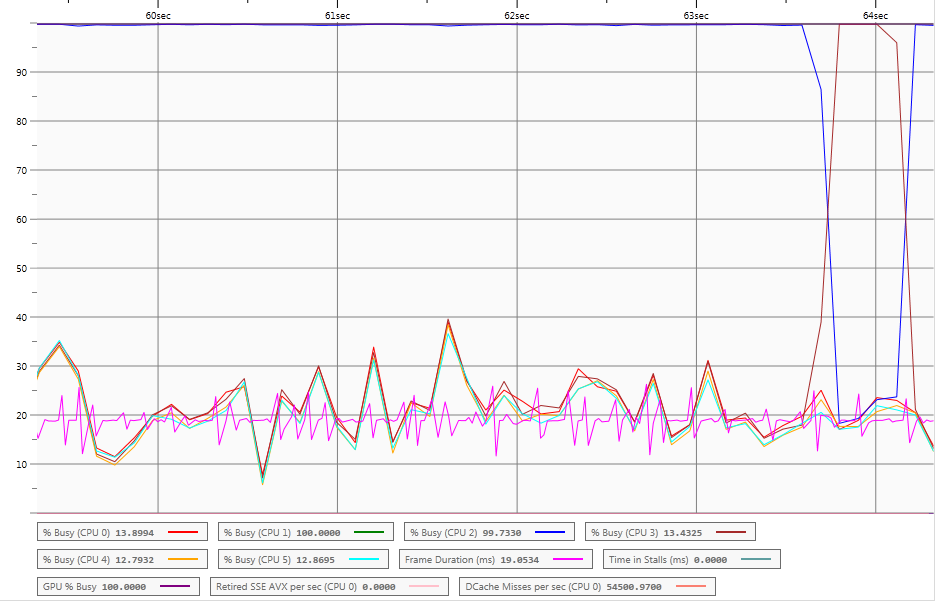
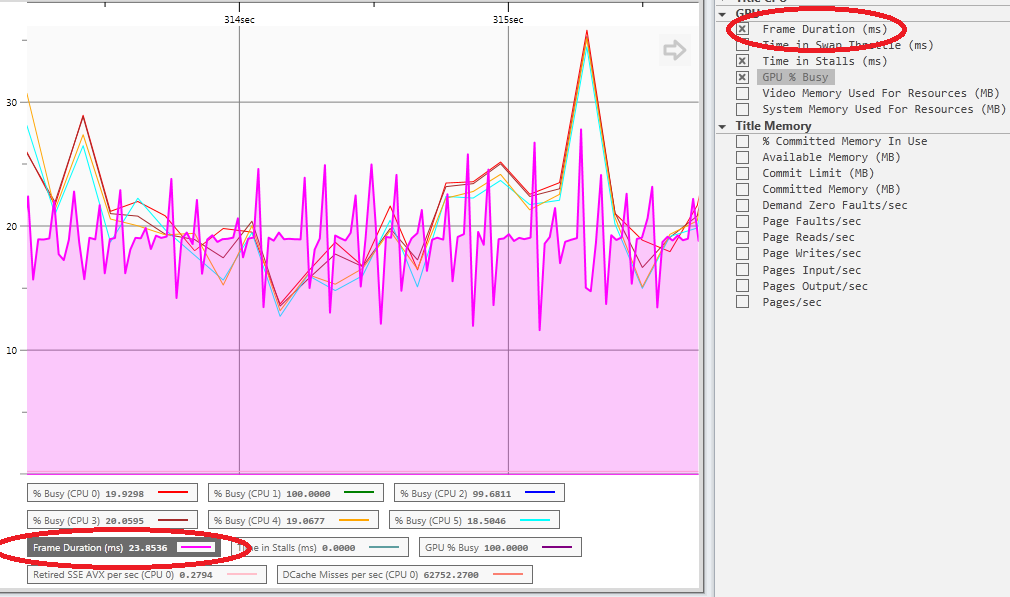
The output of System Monitor shows a continuously-updated graph, which represents the state of the Xbox One game title being profiled by PIX. The graph displays histograms of counter data. The horizontal (x) axis represents elapsed time since monitoring commenced. You can use the horizontal scroll bar at the bottom of the graph pane to pan across the entire data history.
Figure 2. Highlight the counter below the graph to fill the histogram.
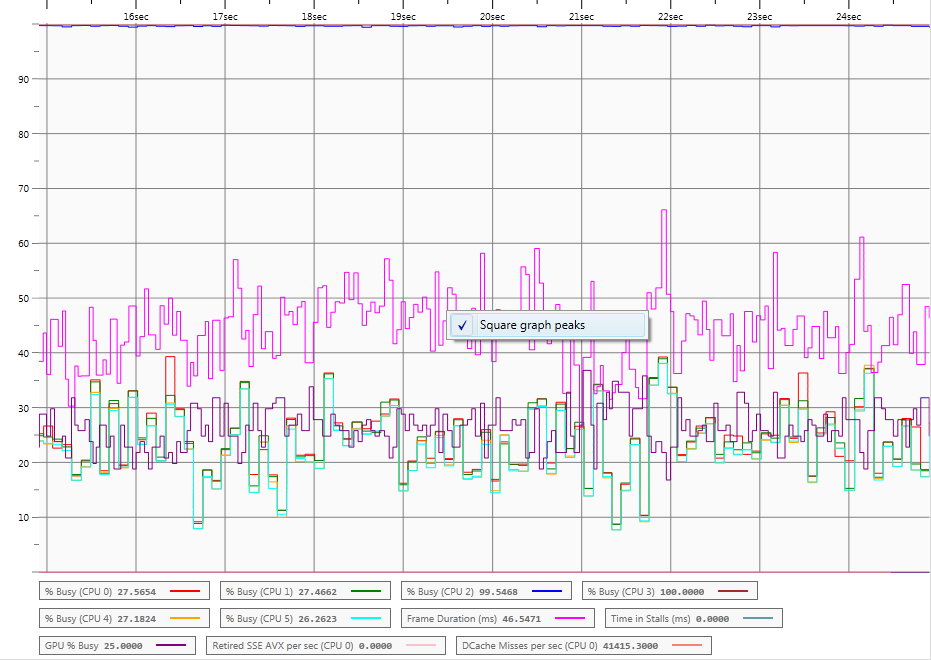
Square Graph Peaks
Right-click on the graph to bring up the option to select Square graph peaks. This display is used to illustrate the nature of the sampling done to get counter values: the points at which the lines change direction are the points at which data is sampled.
Figure 3. Turn off square peaks by toggling the menu entry.