CPU Performance (xbperf.exe)
Starts or stops an event tracing session on the remote console.
xbperf [/start] [/stop etlfile] [/nocallstack] [/nosampling] [/interval n] [/X address]
|
| Option | Description |
|---|---|
| /start | Starts a profiling session on the remote console. |
| /stop etlfile | Stops a profile session on the remote console and writes the trace file to etlfile. Default: xbperf.etl in the current directory. |
| /nocallstack | Disables CPU call stack collection. Disabling collecting stacks will make diagnosing some performance problems harder, but reduces the overhead of the command. Default: enabled. |
| /nosampling | Disables CPU Time based Profiling collection. Disabling Profiling will make diagnosing application performance problems difficult, but reduces the overhead of the command. Default: enabled. |
| /interval n | Sets the CPU sampling interval in units of 100ns. Valid values of n are in the range 1000 to 10000000. A value of 10000 collects one sample per millisecond. Default: n = 10000. |
| /X address | Specifies the host name or address of the remote console. Does not change the default console. If you do not provide this switch, the default console (previously set with Connect (xbconnect.exe)) is used as the remote console. To connect to the exclusive partition, specify /X/title. |
Remarks
This tool replaces the earlier tracelog tool.
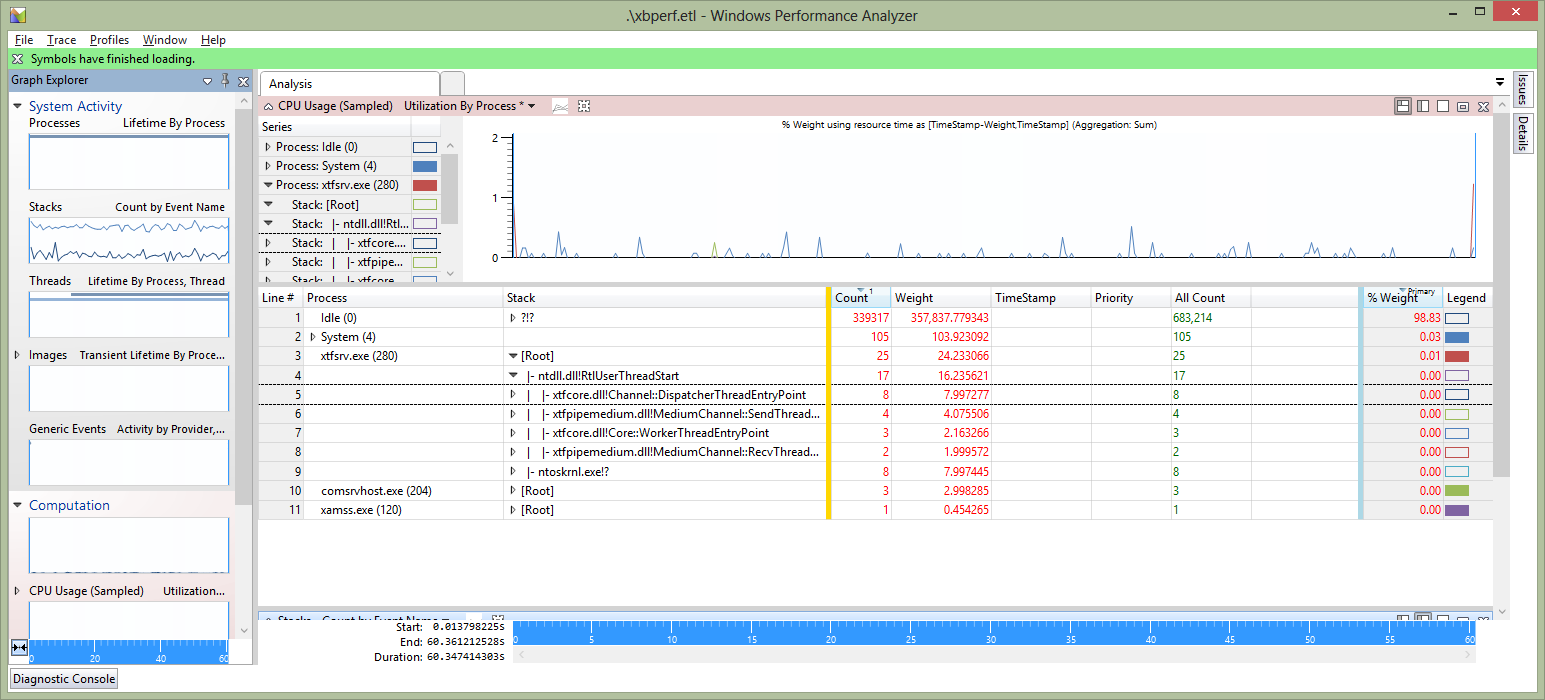
The trace file is written to your development PC. In order to analyze the data use the Windows Performance Analyzer (WPA) tool. This tool is installed as part of the XDK and is available in the bin\wpa folder. Alternatively the tool is also installed by Visual Studio.
Using the tool can affect title performance on the console, so consider extending the timing interval, or disabling the capture of call stacks, if that is the case.
The tool should be useful in identifying problems with CPU bound apps, such as excessive context switching between threads.
For more information on using WPA, refer to Introduction to WPA.
Figure 1. Using WPA to examine CPU performance of the console.
xbPerf will write its tracing data to a USB drive if you have a drive plugged in and configured as developer storage (see Accessing Additional Storage for Development Scenarios) . Writing tracing data to a USB drive will result in more accurate profiling when using xbPerf, especially when profiling your title’s file io patterns.
For GPU performance capture, refer to PIX Setup and Getting Started.
Example
xbperf /START /X/TITLE /PROFINT 5000 /NOPROFSTACK
xbperf /STOP mytracefile.etl /X/TITLE
xbperf /START /X 11.111.111.111/TITLE
xbperf /STOP /X 11.111.111.111/TITLE