Finding Threading Issues
Andrew Farrier, Advanced Technology Group
Updated June 14, 2017
In this topic
Common steps for finding issues
Appendix A: Batch file to create traces
Introduction
This paper covers the high-level steps needed to find common threading issues within an Xbox One title. Useful related documentation that’s available on the Xbox Game Dev site (XGD) includes:
- Top CPU Performance Issues presentation (Xfest 2015)
- Thread Synchronization on Xbox One white paper
- Extending Profiling with ETW on Xbox One white paper
- Xbox One CPU Introduction white paper
The same data is available in both Windows Performance Analyzer (WPA) and Performance Investigator for Xbox (PIX). However, WPA is used throughout this paper for consistency and to provide customized views for each issue.
Several WPA profiles are included with the June 2015 XDK and later, and are referenced in this paper.
The WPA profiles that are provided to help locate issues use the New Thread Stack (Frame Tags) column. This is the call stack of the thread gaining control of the CPU core. In all cases, this will also be the call stack when the thread loses the CPU core. This column is not enabled by default because it can add a lot of noise to the data. It can be enabled if needed by using the context menu on the column of the Data Table.
Common steps for finding issues
You can track down threading issues by using either PIX or WPA. PIX provides a fine-tuned interface directed towards game developers and reduces the information to just the pieces needed. WPA, on the other hand, provides all the information with no filter. You must create your own filters, which involves a very steep learning curve but can provide a much deeper insight into what’s going on internally.
PIX
Using PIX is very straightforward: all you need to do is create a timing capture. This can be done through either an Immediate or a Continuous capture.
Immediate
Immediate timing captures allow captures of up to two seconds of data. They are useful for very quick captures when you’re already at the location of the issue.
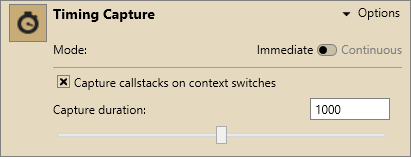
- From the initial PIX System Monitor and Xbox Connect screen, expand the Timing Capture dialog box by selecting Options. You’ll see a dialog like this.
Figure 1: Immediate Timing Capture options
-
Make sure that both Immediate and Capture callstacks on context switches are selected.
-
Use the slider or edit box to specify the capture duration you want.
-
Select the stopwatch icon to start the capture.
-
When PIX is done capturing, the initial Timeline Events window opens.
-
Switch to the Timeline view for each of the steps mentioned in the Common issues encountered section later in this document.
Continuous
Continuous timing captures are useful when the you don’t know exactly where in the title the issue is happening. Internally, continuous capture uses a fixed-size ring buffer to hold the captured data. This also means that it’s possible to capture more than two seconds of data, depending on the number of PIX event API calls the title makes per frame.
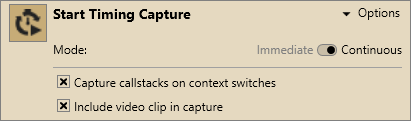
- From the initial PIX System Monitor and Xbox Connect screen, expand the Timing Capture dialog box by selecting Options. You’ll see a dialog like this.
Figure 2: Continuous Timing Capture options
-
Make sure that both Continuous and Capture callstacks on context switches are selected.
-
Include a video clip with the capture if you want. This may help narrow down where in the game play the issue happened.
-
Select the icon in the upper-left corner of the dialog box to start the capture.
-
After you’ve captured enough data, select the icon again to pause the capture.
-
In the System Monitor, select Download All.
-
A new *Timing Capture will appear, where you can select a subsection of that particular set of downloaded data.
-
Select an interesting range within the graph shown and then select Open selected timing data in the details pane. PIX loads that data and starts with the initial Timeline Events window.
-
Switch to the Timeline view for each of the steps mentioned in the Common issues encountered section later in this document.
WPA
To use WPA, the first step is to run the tracelog command or xbperf to create an ETL capture. The tracelog command is preferred because it allows greater flexibility in choosing the data collected.
- For a batch file that automatically handles tracelog for captures, see Appendix A: Batch file to create traces.
- To start the capture as soon as the title starts up, append xbconnect /wt to the start of the batch file and run the batch command before starting the title.
-
The included batch file will automatically open the ETL file in WPA if WPA is in your path.
- Load the symbols by using the trace menu in WPA.
- Make sure the Symbol path is configured correctly through the trace menu:
- The default path comes from the _NT_SYMBOL_PATH environment variable.
- WPA will process the pdb files and store a cache for faster lookup in the SymCache path. Use the _NT_SYMCACHE_PATH environment variable to override the default.
- In some cases, WPA will take a long time to load the symbols. The main cause is that it needs to build a cache for each pdb file. For larger pdb files this can take several minutes. However, it only needs to do this the first time a pdb is seen.
- Make sure the Symbol path is configured correctly through the trace menu:
Common issues encountered
- Threads locking
- Serialization
- High context switch rate
- Core utilization idle
- Core utilization spinning
- Threads floating
Threads locking
Thread locking is when a thread stalls while waiting on a threading primitive. For example, a CRITICAL_SECTION is being used to protect access to a shared resource. If two threads try to access the shared resource at the same time, one of the threads will lock. The locked thread is unable to continue execution until the shared resource is available.
PIX
The question “Where are my threads locking?” is easy to answer by using PIX. The Timeline window provides an easy way to see when threads are running, which core they’re running on, and why they were switched out.
To locate where your thread is locking in code:
-
Perform the common steps discussed earlier in this paper to generate a timing capture by using PIX.
-
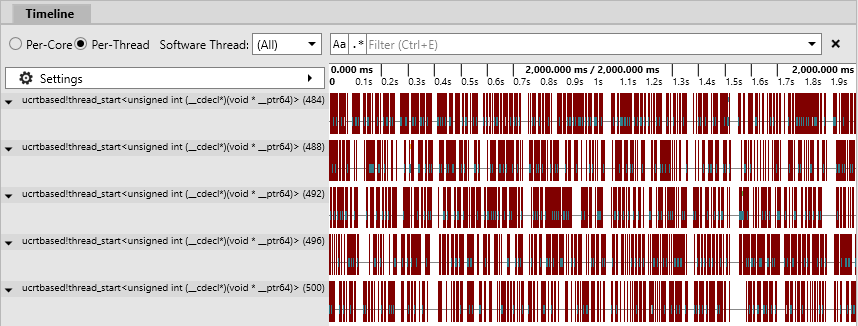
You’ll see a window like one of these two. They’re almost identical. The only difference is that the first window shows a timeline based on CPU cores, and the second window shows a timeline based on threads. You can switch between them using the two radio buttons shown in the upper-left corner of the window.
Figure 3: Initial Per-Core timing capture timeline.
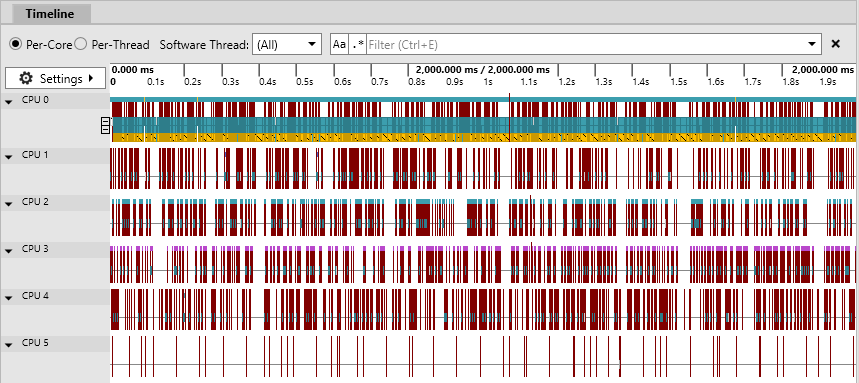
Figure 4: Initial Per-Thread timing capture timeline.
-
Note that each of the larger, dark-red lines represents a context switch.
-
Zoom into a region of interest by selecting the region and, from the right-click context menu, selecting Zoom to selection. You’ll eventually see a window like this.
Figure 5: Zoom-in section of the timing capture.
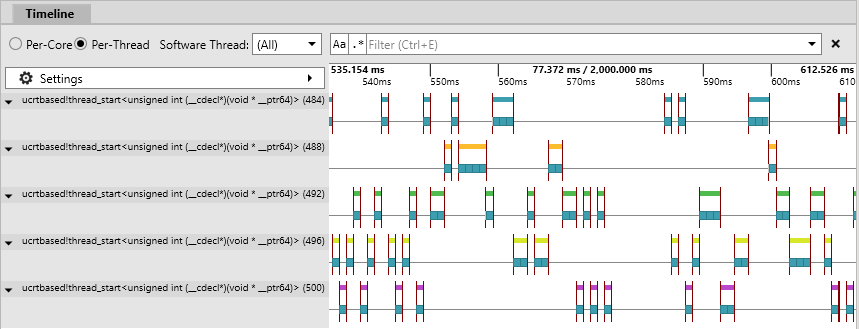
- In this example, notice the vertical, dark-red lines on either end of the blocks where the threads are executing. Selecting any of the lines will select the context switch and look like this.
Figure 6: Context switch associated with when a thread started running.
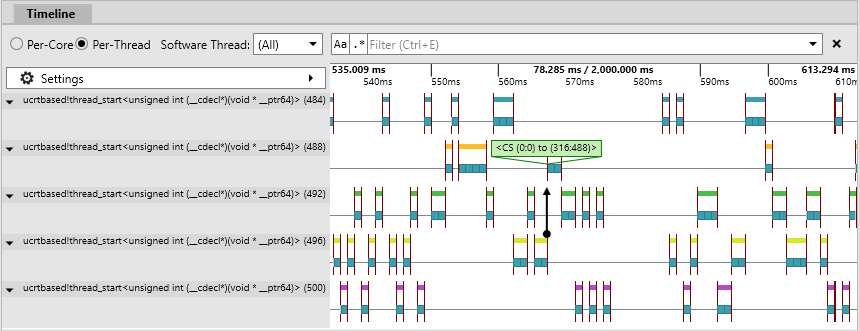
- Look at the Callstack window in the lower-right portion of the screen. It fills in the call stacks for this context switch: the thread swapping out, the thread swapping in, and the readying thread if it’s available. In this case the context switch is from thread 0 (idle) to thread 488.
Figure 7: Associated call stack for the thread that started executing from the selected context switch.
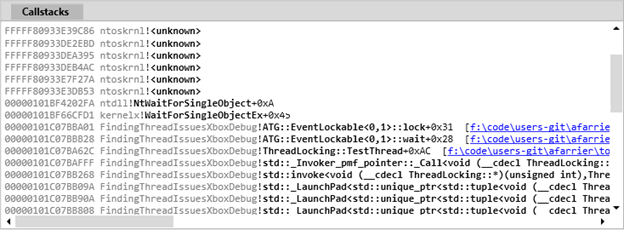
-
Notice that here, the thread resumed from a call to ATG::EventLockable, a wrapper for a Windows event object.
-
You can also expand the readying thread data if it’s available. Some context switches do not have readying thread data—for example, waking from sleep.
Figure 8: Associated call stack for the thread that readied the executing thread from the selected context switch.
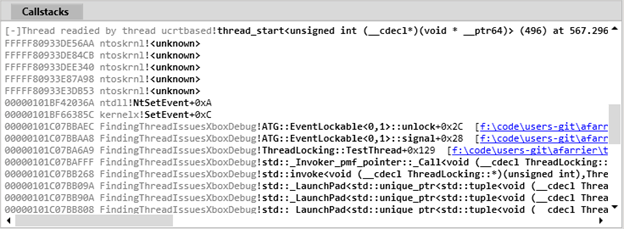
- In this example, the original context switch was readied by thread 496 setting the Windows event that thread 488 was waiting for.
WPA
The question “Where are my threads locking?” is easy to answer by using WPA. The default capture options used by xbperf already capture the required data. However, we recommend using the included batch file, Appendix A: Batch file to create traces, for better control of the capture. For details about using xbperf, see “CPU Performance (xbperf.exe)” in the XDK documentation.
The two best views to use are CPU Usage (Precise) Timeline by Process, Thread or CPU Usage (Precise) Timeline by CPU. These views are based on context switches and show exactly when a thread is being switched out and the call stack in question.
To locate where your thread is locking:
-
Perform the common steps discussed earlier in this paper to generate an ETL file.
-
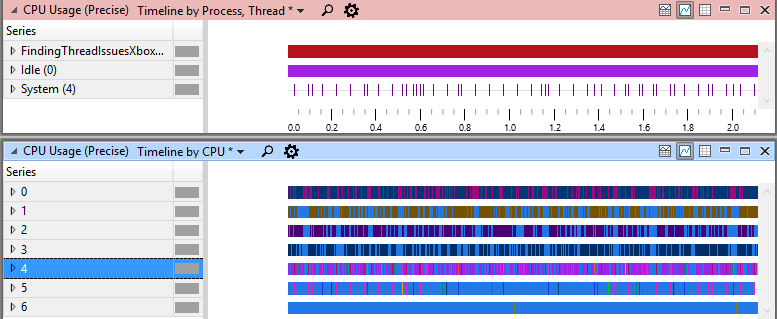
Use the ThreadLocking profile included with this white paper or provided by PIX <XDK install dir>\bin\wpa\profiles> (see Figure 1).
Figure 9: Default view provided by the ThreadLocking profile.
- Depending on whether the issue is related to a specific thread or CPU core, use the relevant sections that follow.
Thread
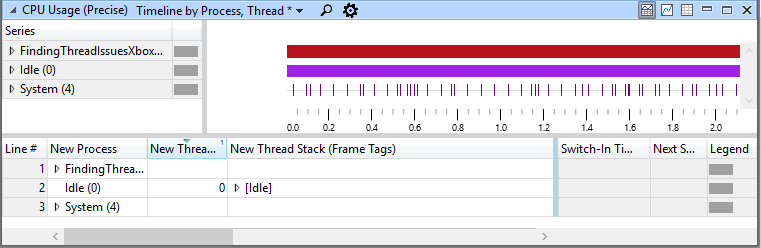
If the issue is localized to a specific thread, focus on the CPU Usage (Precise) Timeline by Process, Thread window.
Figure 10: Timeline by Process, Thread window from the ThreadLocking profile.
-
Select the thread of interest. All relevant sections will be highlighted in the graph.
-
Zoom in to a section of the timeline that is of interest. This helps remove the noise from other threads that might be running. A good starting point is one frame of execution.
-
Look for a location in the thread in question that just started execution after locking for a considerable amount of time or starting/stopping for a significant number of times. Zoom in to the relevant section.
Figure 11: Zoomed in to time where threads are being switched out from processing.
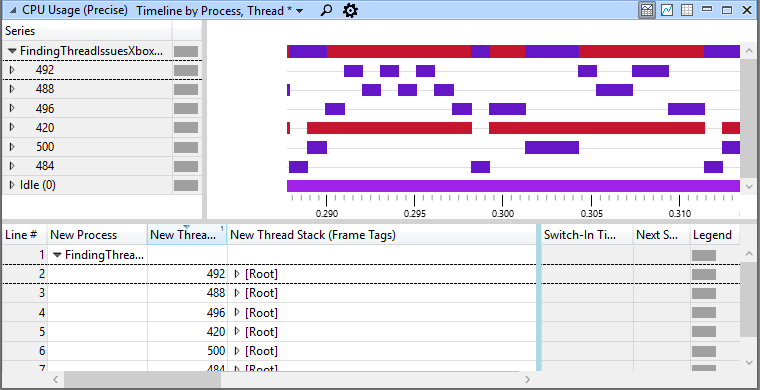
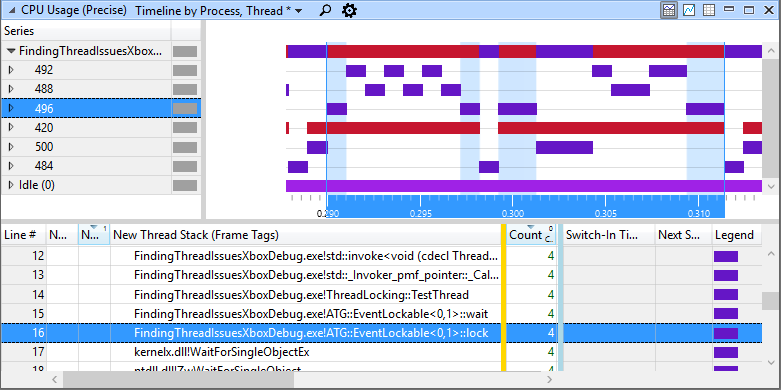
- Select a specific time when the thread is executing. The matching section will be highlighted in the Data Table. The call stack will show the location in the code where the thread was swapped out.
Figure 12: Thread timeline for thread 496 showing that it was being switched out four times through ATG::EventLockable.
-
There could be a variety of reasons the thread was swapped out. Drilling into different locations and threads will provide a better picture of what is happening in the code.
-
You can also look at the Ready Thread Stack column, which shows which thread in the system caused the context switch—for example, releasing a CRITICAL_SECTION.
CPU
If the issue is more general or localized to a CPU core, focus on the CPU Usage (Precise) Timeline by CPU window. The steps are like those for using the CPU Usage (Precise) Timeline by Process, Thread window.
Common causes
- Tight loop using **SwitchToThread in a spin lock**
- High contention on the spin lock; consider extending the spin count.
- EnterCriticalSectionContended
- High contention on a critical section; consider extending the spin count.
- WaitForSingleObject
- Thread communication too high
- Consider a different algorithm that does not need a primitive.
- Batch up communication.
- Jobs available
- Not enough work to perform. Consider increasing job complexity.
- Jobs finishing before new job ready. Consider a spin on the WaitForSingleObject before blocking.
- Thread communication too high
- Priority Inversion – Low priority thread is holding a lock that a high priority thread needs
- Low priority thread suspended. Consider adjusting thread priorities to compensate.
Serialization
Thread serialization is a problem that can arise from a quick conversion of a single-threaded algorithm to a multi-threaded algorithm. Each block from the single-threaded algorithm is waiting on the previous block to finish. There are two issues this causes:
-
The extra overhead switching between threads.
-
Stalls in overall execution of the algorithm if the steps are not running parallel.
Use the same steps found in the Threads Locking section mentioned earlier to narrow down the issue. Focus on the locations where the stair-step effect is happening between threads and/or CPU cores.
PIX
In a PIX timeline, the stair-step pattern looks like this.
Figure 13: Stair-step pattern in Per-Thread view in timing capture timeline.
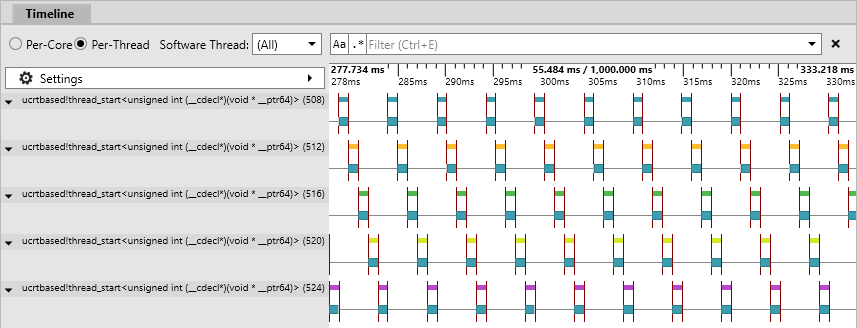
The context-switch window shown in the Threads Locking section will help you narrow down to the exact line of code that’s causing the serialization issue.
WPA
Figure 14: Timeline by Process, Thread window showing a stair-step effect where threads are not running in parallel.
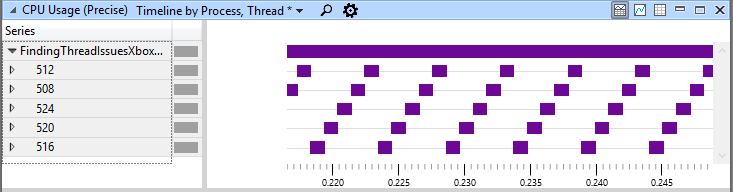
A similar effect happens if there is a high dependence between jobs in the job system. This can be hard to track down within WPA depending on the pattern your job system uses.
If the title has worker threads that spin looking for work, adding an ETW event is useful. For details about adding these, see the Extending Profiling with ETW on Xbox One white paper. Events should be added around the spinning block and the processing block on the worker thread. The Generic Events Activity by Provider, Task, Opcode window in WPA will show when each event is firing.
Figure 15: Addition of Generic Events window to show when title locking primitives (30, 31) are being used.
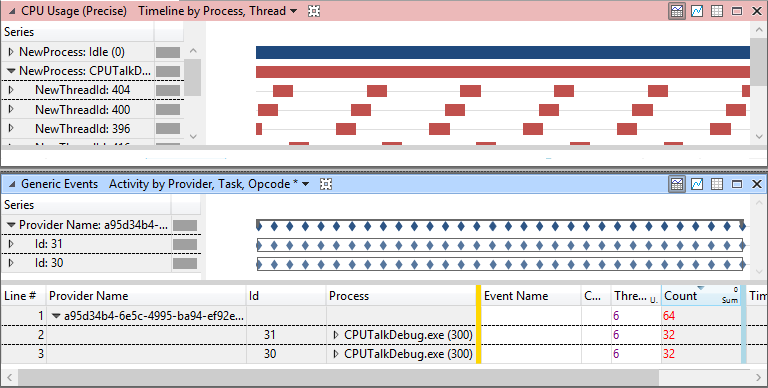
Context switch too high
Rapid context switching between threads can be very expensive. The first and easily measurable cost is from the kernel itself. This is on average 5 microseconds. The second cost is not easily quantifiable, the cost of the cache being out of date. For a discussion about the overall cost of a context switch, see the paper Quantifying the Cost of Context Switch.
Of note, however, is that WPA will only show context switches that happen in the ERA partition. An underlying switch can happen at the base hypervisor level and give you a similar cost, especially in regard to the cache. This is most common on the seventh core where you can lose the core for up to 50% of the time.
PIX
Pix does not give you an exact count of the number of context switches per second that the title is performing, but it can give you a very good idea of when the context-switch rate is too high.
-
Start with the common steps.
-
Focus on the per-core page in the Timeline view.
Figure 16: Initial Per-Core view in a timing capture, showing a very high number of context switches.
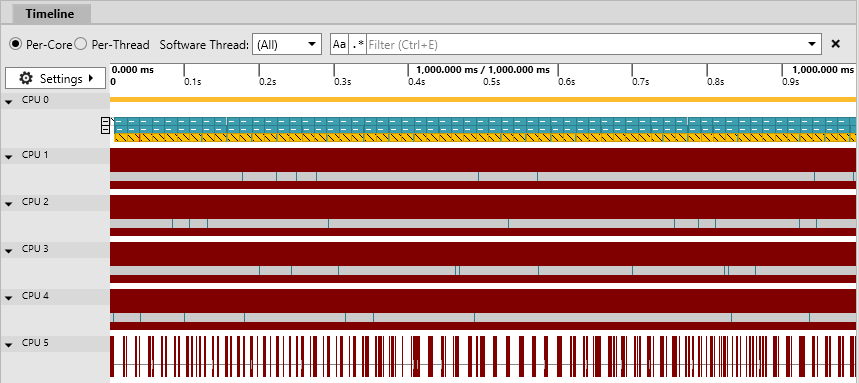
-
The dark-red, vertical lines represent context switches. In this case, for the entire one-second capture, it’s one large block of dark red. This is a good indication that there are too many context switches in the title.
-
To confirm, drill down to one frame.
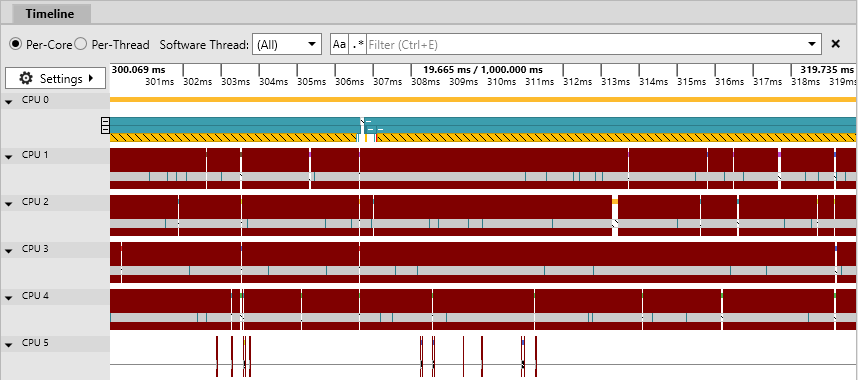
Figure 17: Zooming into 20 ms of a timing capture showing a very high number of context switches.
-
This example covers only about 20ms. You can still see that most of the timeline is solid, dark red, representing context switches. This is an even stronger indication that the context-switch rate is too high.
-
Following the steps in Thread Locking will help you determine where the threads are locking in the code.
-
In the lower-left window, there is a Context Switch tab that shows all the context switches in the capture. You can use this to help select specific switches in the capture
WPA
The best window to use is the CPU Usage (Precise) Context Switch Count by Process, Thread window. The graph will show the number of context switches per second that were performed based on the amount of time visible. The amount visible is important; zooming will adjust the number per second (one per millisecond is 1000 per second).
To determine the number of context switches:
-
Perform the common steps to generate an ETL file.
-
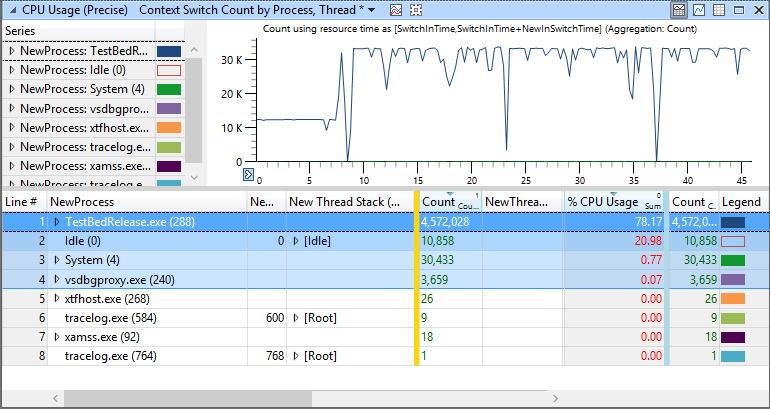
Use the ThreadContextSwitch profile included with this white paper or provided by PIX <XDK install dir>\bin\wpa\profiles> (see Figure 9).
Figure 18: Default view provided by the ThreadContextSwitch profile. Note the very high context switch count, at 2,000.
- Zoom in to an area of interest; one second that looks high is a good starting point.
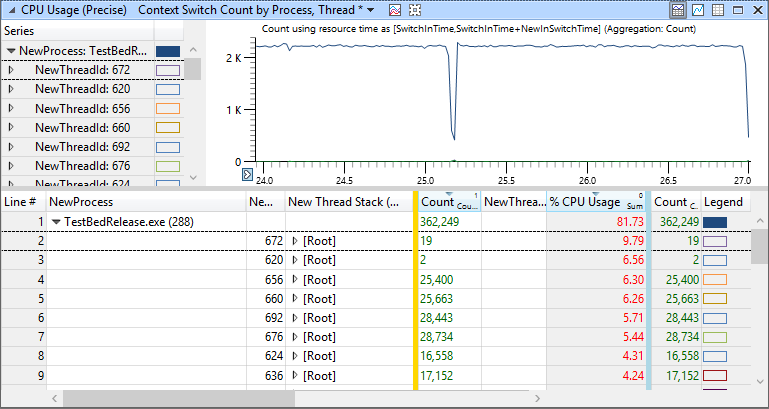
- Look at the Count column in the Data Table to see which threads have the highest switches. There may be threads with similar counts; this is an indicator that the threads in question are toggling between each other.
Figure 19: A time interval when context switch rate was high. Scale has been adjusted for just the scaled view.
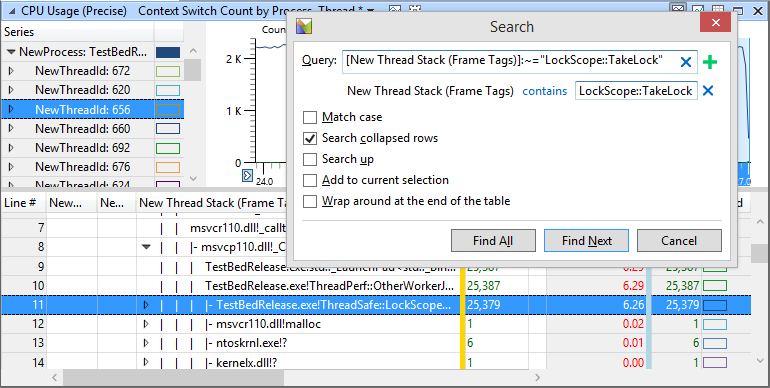
- Expand the call stacks through the highest count to find the relevant location in the title code. Using the Find option on the function name with Find All will locate other threads that may be using the same primitive or function.
Figure 20: Using the find feature to locate all uses of the title function SwitchToThread.
Common causes
- Contention on a threading primitive, for example, a CRITICAL_SECTION
- Too many title threads are using the same CRITICAL_SECTION.
- SwitchToThread in a tight loop with other threads ready to run
- If another thread is ready to run, this will always result in a context switch.
- High priority thread switching to ready to run rapidly
- The OS will perform a context switch if a higher priority thread is no longer blocked.
Core utilization
If all cores aren’t running at 100% doing useful work, there is room for improvement. The easiest issue to locate is idle time on a core. The harder issue is when the core is just spinning doing nothing useful. In most cases it’s actually very difficult to keep a core pegged at 100%, so the first red flag is seeing a core pegged at 100% for an extended period of time.
PIX
The timeline view in PIX can very quickly show you the utilization of CPU cores.
-
Start with the common steps to create a timing capture.
-
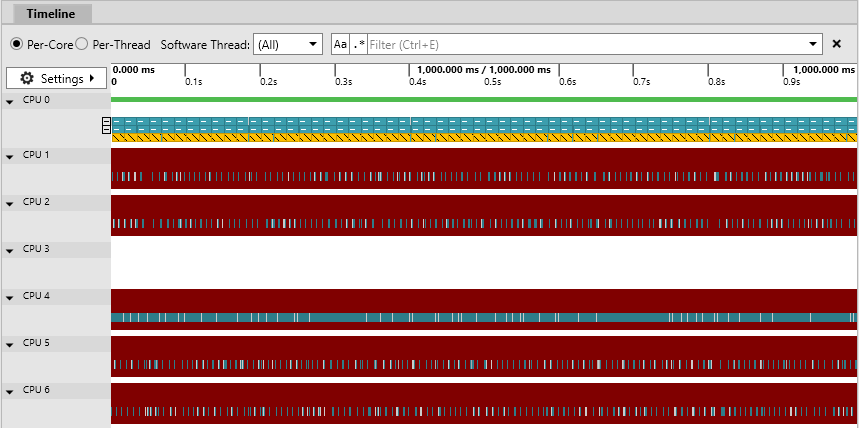
Starting at the top-level view for the capture, look for times when a core is obviously not executing code. In this case, core 3 is performing no work.
Figure 21: Initial Per-Core view of a timing capture showing an idle core.
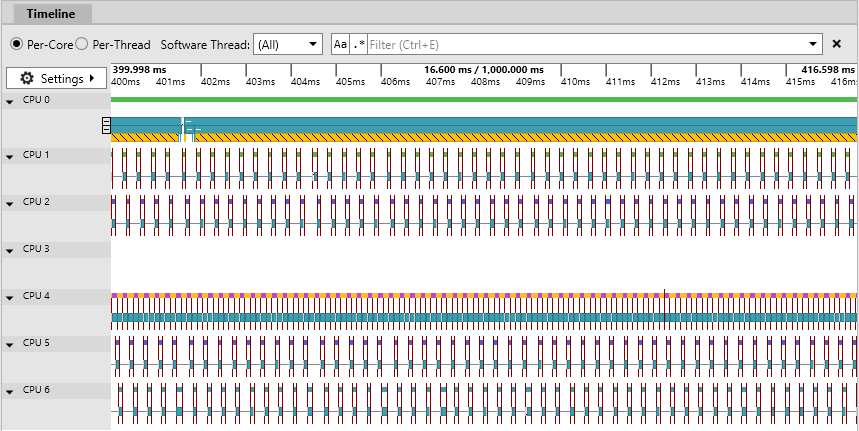
- Zoom in until you get to a frame of interest. In this case, we’ve zoomed into 16.67 ms worth of time, or one frame.
Figure 22: Zoomed into 16.67 ms of time, showing an idle core and low-utilization cores.
-
Notice that clearly that cores 0 and 4 are both running at 100%, but that cores 1, 2, and 6 are running at about 50%.
-
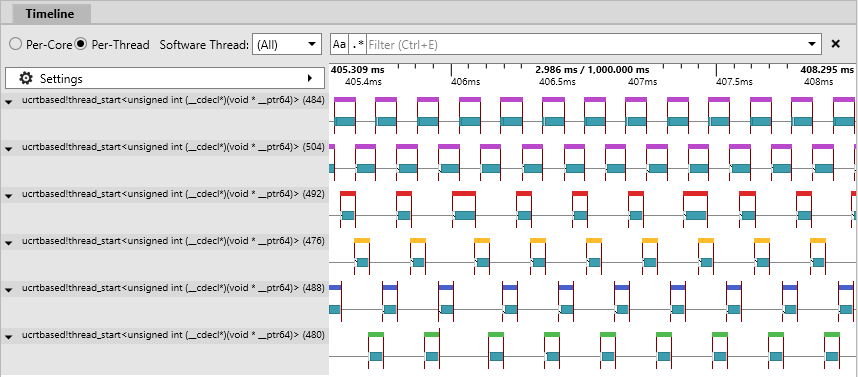
You can perform the same steps in the Per-Thread view of the timeline. This allows you to focus on a thread that you think should be running at close to 100%.
Figure 23: Zooming into 3 ms of time in Per-Thread view, showing stalls on each thread.
-
You can clearly see when the threads are running. The different colored blocks at the top of each block represent the core that the thread is executing on. The top two threads have a violet bar, which means they’re both running on the same core.
-
You can use the same steps as Thread Locking to narrow down to the lines of code that are causing the threads and cores to stop executing
WPA
There are two main windows that show how much time a title is taking on the system. The first is CPU Usage (precise) Utilization by CPU, which will show data relative to the core. This can quickly show where there might be extra room available to allow a thread to run. The second is CPU Usage (precise) Utilization by Process, Thread, which will show which threads are idle most of the time or are hogging the cores.
Idle
The time a CPU core spends idle is time that could be spent performing useful work. Finding these locations helps determine if the title is blocking needlessly or has spare cycles to handle other work.
To locate idle time on a core:
-
Perform the common steps to generate an ETL file.
-
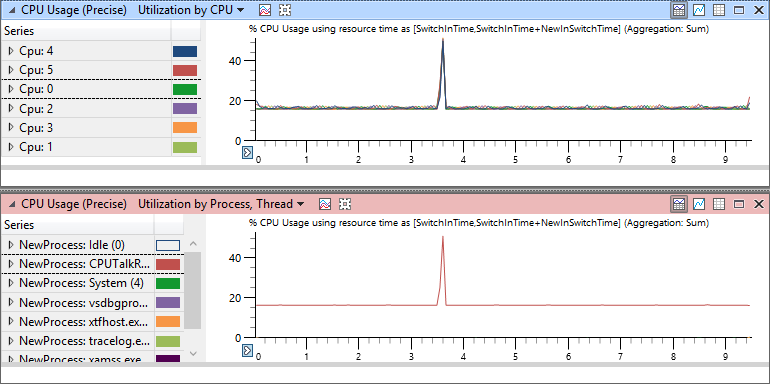
Use the ThreadUtilization profile included with this white paper or provided by PIX <XDK install dir>\bin\wpa\profiles> (see Figure 12).
Figure 24: Default view provided by the ThreadUtilization profile.
CPU
To focus on a CPU core that is not being properly utilized:
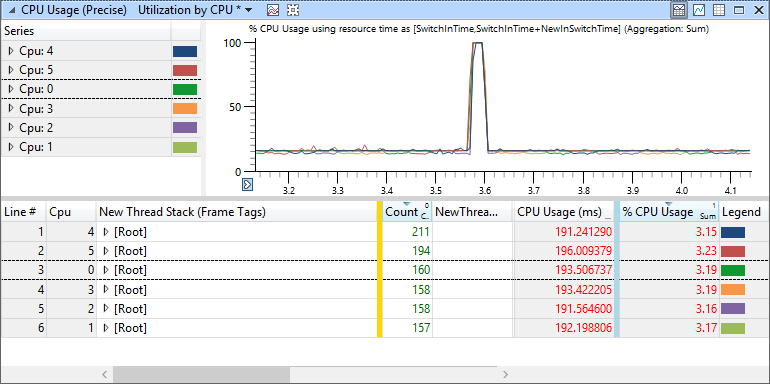
- Use the % CPU Usage column to point toward likely candidates at the CPU level. The percentage is based on 100% being the entire CPU, not per core. Therefore, 16.67% for a single core represents a single core at 100%. In this case, the 7th core is not enabled, so there is 100/6 = 16.67% available per core.
Figure 25: Focusing on only the utilization by CPU. Only core 4 is running at 100%.
-
Zoom in to areas on the graph where a CPU core is idle or very busy.
-
Drill down the call stacks in the Data Table to find the locations where the title is gaining control of the CPU.
- The % CPU Usage column shows the overall percentage of time spent relative to 100% being the entire CPU, not per core.
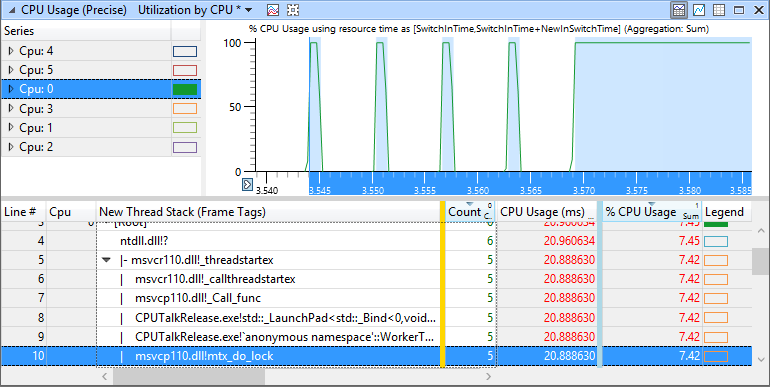
- The functions in question match when the title lost the core, but there was no ready thread to schedule on that core.
Figure 26: Zooming in to a block of time covering ramp-up to full CPU usage. std::mutex was keeping CPU utilization low.
Thread
To focus on a thread that is not running as expected:
-
Use the CPU Usage (precise) Utilization by Process, Thread window to narrow down the issue by thread.
-
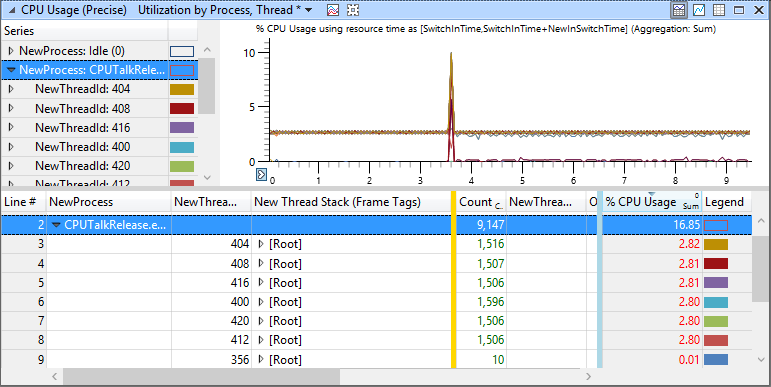
Look for threads that are running at a lower than expected % CPU Usage. The percentage is based on 100% being the entire CPU, not per core.
- One likely candidate is a single thread locked to a core that should always be running.
Figure 27: Using the Utilization by Process, Thread window provided by the ThreadUtilization profile.
-
Zoom in to a section of interest to limit the amount of data to sort through in the Data Table.
-
Drill down the call stack to find the locations where the thread is gaining control of the CPU core.
- The % CPU Usage column shows the overall percentage of time spent relative to 100% being the entire CPU, not per core.
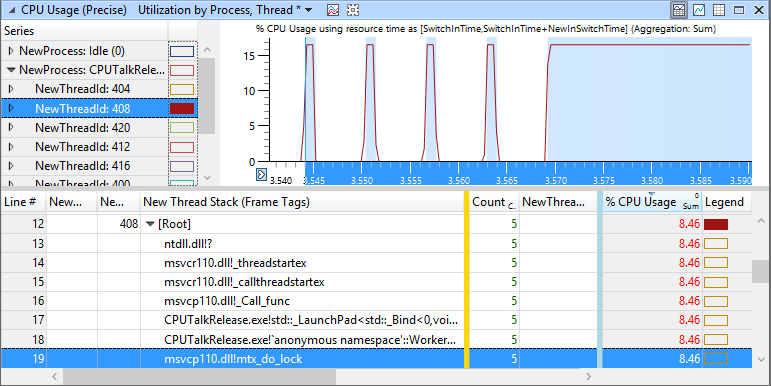
- The functions in question match when the thread lost the core.
Figure 28: Zooming in to the time when the utilization ramps up; std::mutex was keeping thread utilization low.
Spinning
Spinning for a very short time can be beneficial in certain circumstances, for example waiting on data that will be available very shortly. However, spinning for an extended period of time is just wasted time when useful work could be performed.
PIX
It’s useful to create a PIX event around all sections of code that could spin. You can do this by using PixBeginEvent and PixEndEvent in your code around the spin block.
-
Start with the common steps to create and load the timing capture.
-
Focus on the Events tab in the lower-left portion of the Timeline window.
-
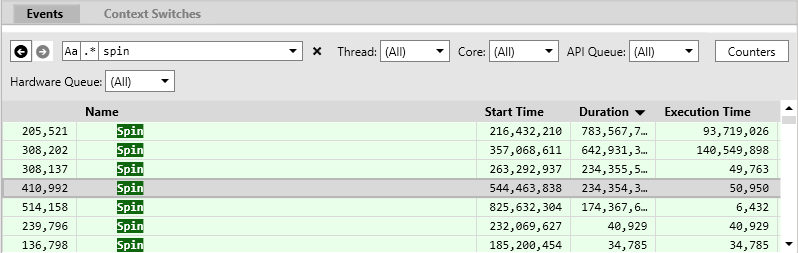
In the search box at the top of the window, type the event name for the spin. In this case, it’s labeled Spin.
Figure 29: List of events from adding a PIX marker when the title spins.
-
Look at both the Duration and Execution columns for each instance. You can sort on either by clicking the column title.
- In the example shown, the highlighted event has a duration of 234 ms and an execution of 50 μs.
- Duration is the total time the event was active, including time the thread was stalled.
- Execution is the total time the event was active and the thread was executing on a core.
- An even worse case is the second Spin event in the example, which was executing for 140ms. The CPU core was executing in the spin loop for the entire 140ms. This was wasted time that could have been spent doing other tasks.
WPA
All locations where a title may spin should be placed in a non-inline function; this makes it very easy to determine if too much time is spent spinning. Since the title is just spinning and not performing a context switch, sampled data must be used. If the title is spinning by rapidly switching between threads with SwitchToThread, use the steps in Context switch too high earlier in this white paper.
To locate spinning on a core:
-
Perform the common steps to generate an ETL file.
-
Use the ThreadSpinning profile included with this white paper or provided by PIX <XDK install dir>\bin\wpa\profiles> (see Figure 17).
Figure 30: Default view provided by the ThreadSpinning profile.
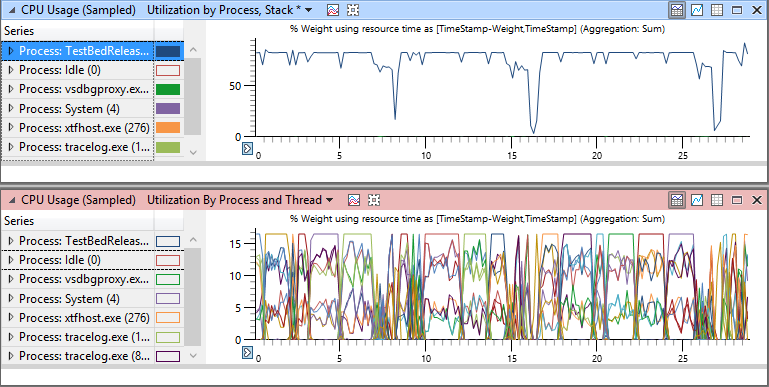
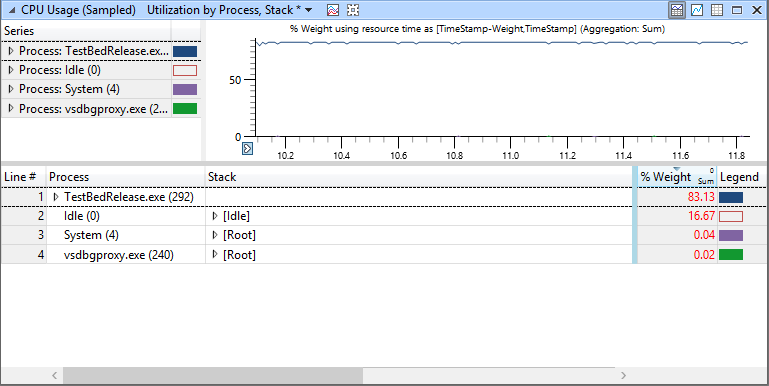
- The % Weight column shows the percentage of samples for each line of the Data Table. This is highly correlated to the total amount of time spent in the function.
Figure 31: Focusing only on Utilization by Process, Stack window. Note: TestBed has 83% of the sampled data.
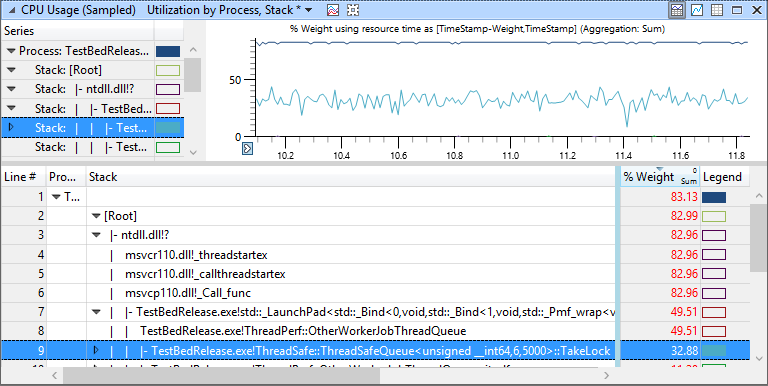
- Use the Find command in the Data Table Stack column for any functions that might spin. Look at the % Weight column to determine if too much time is being spent spinning.
Figure 32: Walking down the call stacks for spin function. TakeLock is responsible for 32% of the samples.
Thread floating
The affinity set for a thread defines on which CPU core a thread can execute. In some cases, this is acceptable, but in other cases it is not. There are two main problems with this:
-
The thread may float to a title critical core. For example, if the title has locked the render thread to core 1, a worker thread may float to core 1 and stall the render thread.
-
The cache will almost always have the wrong data in it, causing a large number of cache misses.
PIX
Determining whether a thread is floating between cores in PIX is very easy. The per-thread view shows this directly.
-
Start with the common steps for creating and loading a timing capture.
-
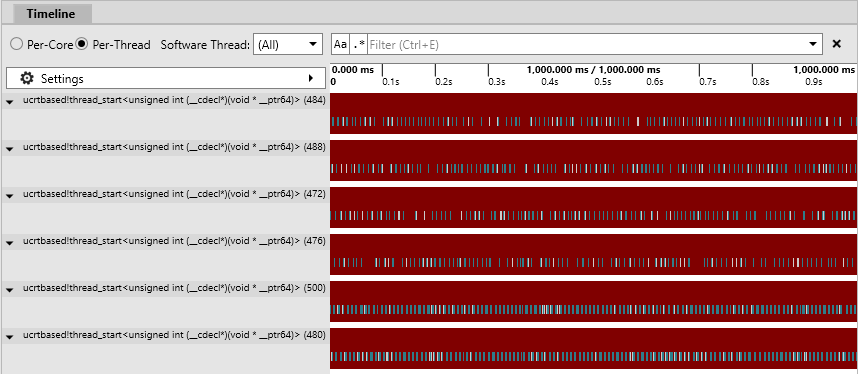
Make sure to have the Per-Thread view selected from the radio buttons in the upper-left portion of the Timeline view.
Figure 33: Initial Per-Thread view for a timing capture focused on key title threads.
-
Zoom in to a section of interest.
-
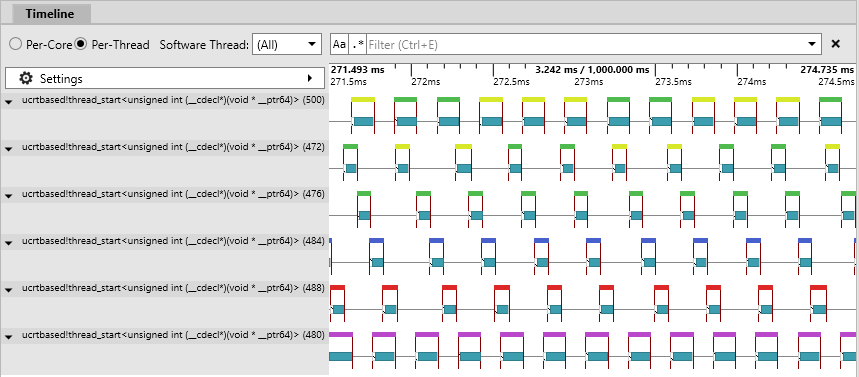
On the timeline for each thread there are two horizontal lines. The lower line represents active PIX events. The top line represents which CPU core the thread is running on.
Figure 34: Zoomed-in, Per-Thread view showing threads that float between cores.
-
Looking at the top two threads, you can see that they’re running on both the yellow core and the green core. They’re floating between those cores.
-
Moving your mouse over any of the horizontals lines highlights all matching sections and displays pop-up text saying exactly which core it represents.
WPA
The CPU Usage (Precise) Timeline by Process, Thread window gives all the information needed to determine if title threads are floating between cores.
To determine if title threads are floating between cores:
-
Perform the common steps to generate an ETL file.
-
Use the ThreadFloating profile provided by PIX <XDK install dir>\bin\wpa\profiles>.
Figure 35: Default view provided by the ThreadFloating profile.
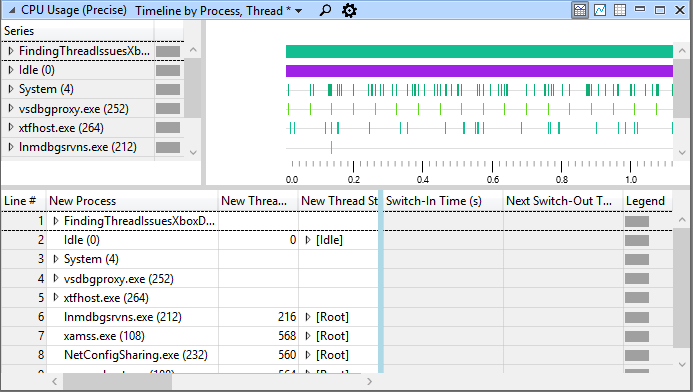
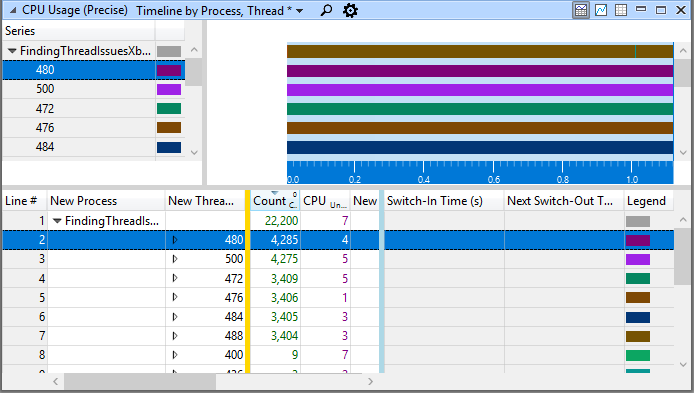
- The CPU column in the Data Table is set up to aggregate on unique values, or the number of different cores on which the thread executed. Values above 1 mean the thread is floating between cores.
Figure 36: Focusing on the threads with the FindingThreadIssues application. Note: Thread 480 was running on four different cores.
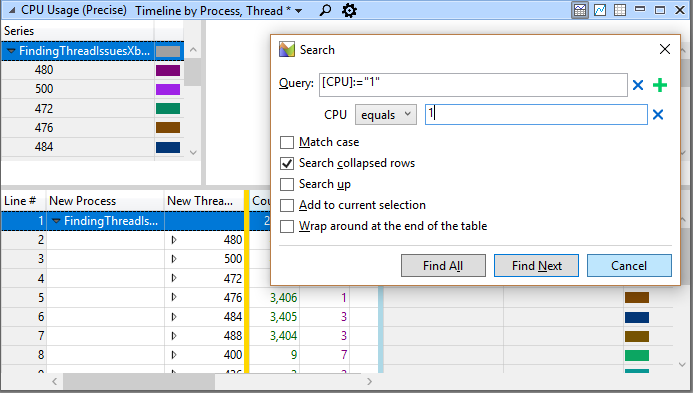
- To find threads floating onto a critical core, use the Find feature on the CPU column in the Data Table. This will highlight all threads floating to that core.
Figure 37: Using the Find feature to locate all threads that were running on core 1 during the capture.
Summary
Following these steps should put you well on your way to locating the cause of common threading issues. If any of your questions were not answered, please visit the Developer Forums. There is a wealth of information there along with people who can help answer your questions.
Appendix A: Batch file to create traces
echo OFF
REM Use the name on the command line for the capture or use the default
set ETWName=%1
if "%1"=="" set ETWName=ThreadData

set SavePath=d:\
xbdir /x/title xd:\profile > NUL
if %ERRORLEVEL% EQU 0 set SavePath=%SavePath%profile\

REM Start the capture on the default Xbox
xbrun /x/title /O tracelog -start %ETWName% -f %SavePath%%ETWName%.etl -eflag DISPATCHER+PROC_THREAD+PROCESS+THREAD+LOADER+CSWITCH+PROFILE -stackwalk PROFILE+CSWITCH+READYTHREAD

REM Wait for the user to press a key when the session has finished capturing
PAUSE

REM Stop the capture, merge the file to resolve events, finally copy the etl file over to the PC
xbrun /x/title /O tracelog -stop %ETWName%
xbrun /x/title /O tracelog -merge %SavePath%%ETWName%.etl %SavePath%%ETWName%_merge.etl
xbcp /x/title x%SavePath%%ETWName%_merge.etl
start %ETWName%_merge.etl