PIX Counters
You can analyze, sort, filter, and graph PIX software counters and hardware counters.
Software Counters
To add software counters into a title use the PIXReportCounter method. This method takes as parameters a name/value pair, where the name is a string that you define, and the value is a float. The value would typically be a duration, count, percentage or similar value. Typically values display more prominently if they are in the range 0 to 100, so consider mapping any larger or smaller values to this range. For example:
PIXReportCounter(L"MyCounterName", MyValue);
Software counters will appear dynamically in the Counters view, and can be selected and added to the graph in the Console view.
Hardware Counters
There are many hundreds of hardware counters (listed in PIX Table of Hardware Counters). For a brief description of a single counter click on the name of the counter in the Column Selector list, and a description will appear at the bottom of the list.
Adding Hardware Counters to the Events List
To add a column that contains the output from a hardware counter to the Events table, select the Counters tab and select one or more of the hardware counters from the long list.
| Counter Set | Description |
|---|---|
| Bottlenecks | Bottlenecks and stalls |
| Vertex related | Vertices, primitives, culling and clipping |
| Texture related | Texture unit and UAVs |
| Shader related | Shader performance and statistics |
| Pixels related | Color, Depth and Stencil, Pixels, Samples and Quads |
| CP | Command Processor. Reads and executes command buffer packets. |
| CB | Color Block. Handles color writes, blending, MSAA and color compression. |
| DB | Depth Block. Handles depth/stencil tests, and depth/stencil compression. |
| GRBM | Graphics Register Bus Manager. |
| SU | Triangle Setup. Handles primitive assembly, clipping and culling. |
| SC | Scan Converter. Handles breaking of the triangles into tiles/quads and Hi-Z tests. |
| SX | Shader Export. Handles shader output of depth, color, vertex position and attributes. |
| SQ | Sequencer. Handles shader instructions execution. |
| TA | Texture Addressing Block. Generates read and write requests for the L1 cache. |
| TD | Texture Data Block. Returns data from L1 cache to the shader pipes. |
| TCP | L1 cache (Texture Cache per Pipe). Handles all texture and buffer reads and writes for shader pipes. |
| TCC | L2 cache (Texture Cache per Channel). Handles all non-CB/DB reads, writes and atomics for the GPU. |
| TCA | L2 cache (Texture Cache Arbiter). |
| GDS | Global Data Share |
| VGT | Vertex Geometry Tesselator. This is the main block responsible for supporting all draw packets. |
| IA | Input Assembler. Receives work groups and breaks them up into prim groups for the VGT. Fetches indices from memory. |
| MC_HV_MCB_L1TLB | HV MCB Level 1 Translation Lookaside Buffer |
| MC_HV_MCD_L1TLB | HV MCD Level 1 Translation Lookaside Buffer |
| MC_MCB_L1TLB | MCB Level 1 Translation Lookaside Buffer |
| MC_MCD_L1TLB | MCD Level 1 Translation Lookaside Buffer |
| MC_HV_L2TLB | Level 2 Translation Lookaside Buffer |
| MC_L2TLB | Memory Controller Level 2 Translation Lookaside Buffer. |
| MC_ARB | Memory Controller Arbiter. Handles arbitration to Frame Buffer memory. |
| MC_CITF | Memory Controller Client Interface. Routes transactions from the high bandwidth clients CB, DB, and TC to their channel mapped channels. |
| MC_HUB | Memory Controller Hub. This routes transactions from the low bandwidth clients and also routes traffic to system memory or remote onchip or offchip memory channels. |
Figure 1. Some hardware counters from a frame of the Simple Ray Tracing sample.
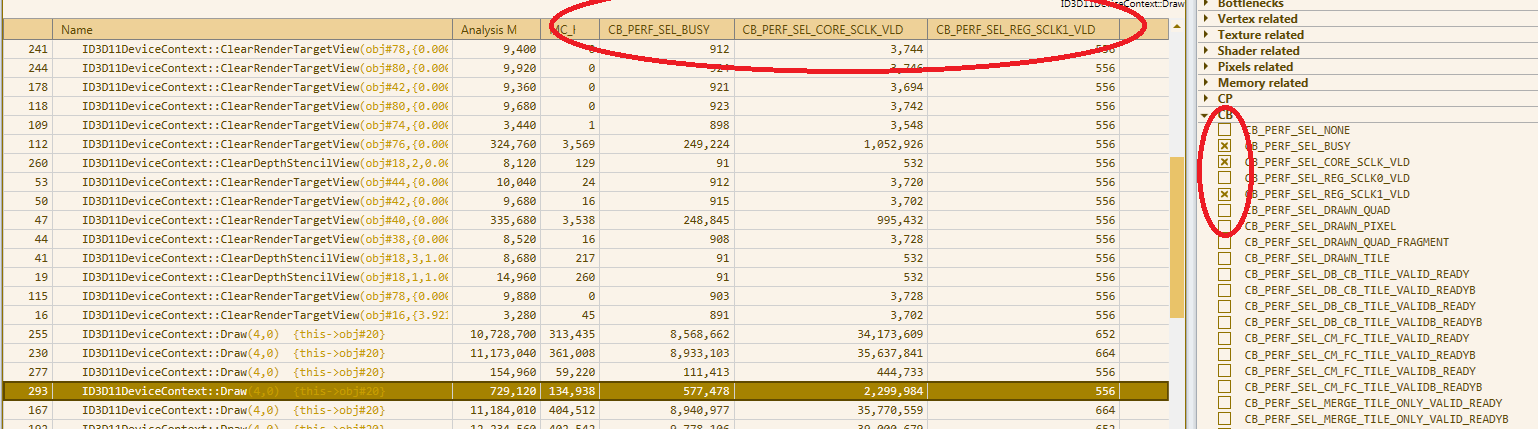
To change the order of columns in the Events window, drag the names to a new location. To delete a column, either deselect it in the Counters window, or simply drag its name away from its column and drop it.
Figure 2. Dragging and deleting a column.

Sorting and Filtering
The Event table can be sorted by clicking on the column header. For a numerical column the sorting will toggle between ascending and descending order. For the Name column the sorting will rotate through ascending alphabetical, descending alphabetical, and the original event order.
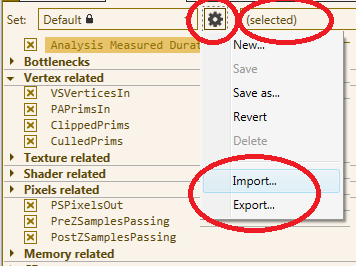
In the Filter drop down list shown in Figure 5, there are three options to control the list of displayed counters.
- (all): display all the hardware counters.
- (selected): display only those counters that have currently been selected.
- Text: enter some text and only those counters with matching text will be displayed.
Counter Graphing
To graph a counter over time, right-click the column header and click Add to Graph. A graph of counts against the timeline will appear. Up to four counters can be added to the graph. To remove a counter from the graph right-click the column header and select Remove from Graph.
Figure 3. The image shows a graph of the number of vertices received (red), against the number of culled primitives (blue).
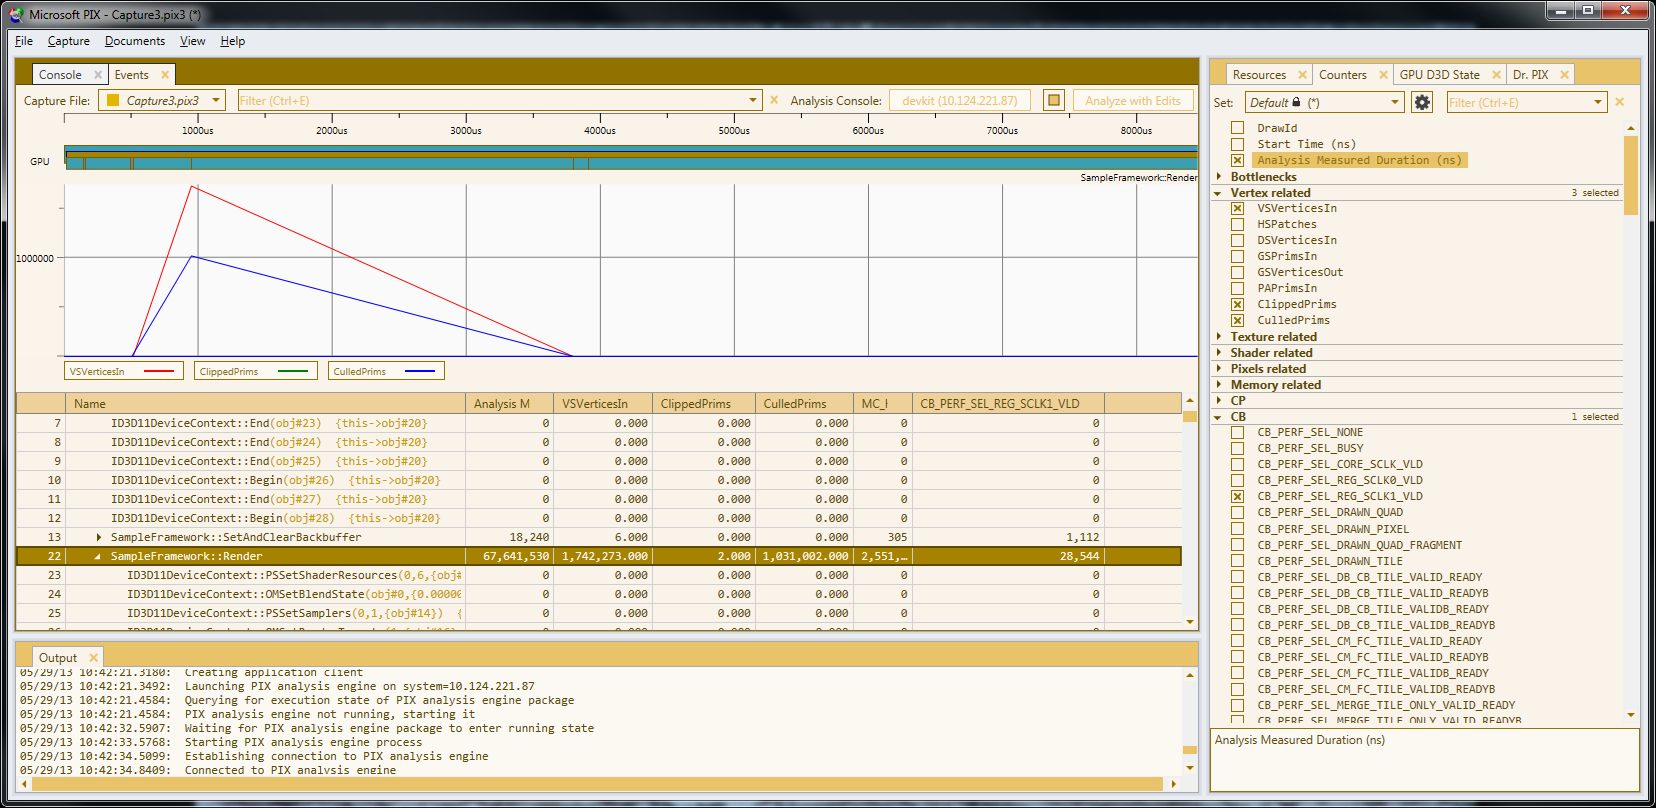
Figure 4. Right click the top of the graph to enable a range of zoom options. Zoom to All is the default view.
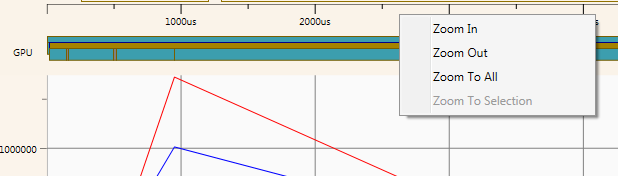
Figure 5. Use the custom menu to import and export counter sets, and the filter to limit the counters listed.
Also see the section Profiling memory traffic in PIX in Xbox One GPU Memory Access: ONION, GARLIC, and More, at XGD white papers.