ATG Systems Engagement Checklist
Introduction
This paper covers the methods to collect the appropriate information for your title to assist the Xbox Advanced Technology Group (ATG) in their analysis of non-graphics performance issues.
The first step in looking for non-GPU issues is to follow the steps in the following white papers; these are the same steps ATG would perform on initial investigation. Initial investigation into issues by your team is always preferable; you know your code and how it should react, and trouble spots should become apparent.
The next step in starting any engagement with the ATG is to work with your Developer Account Manager (DAM). They will be able to determine the appropriate contacts based on your needs, and will serve as your liaison and champion throughout the entire engagement. When in doubt, always check with your DAM.
Different areas of a title require different tools to collect information. You don’t want to use a GPU frame capture to determine if your file loading code could be improved. Conversely, using Event Tracing for Windows (ETW) to capture data will not give a detailed look into how the L1 data cache is being used on the CPU.
If possible, a copy of your latest build along with matching symbol files (PDBs) is preferable for ATG. This build should be an encrypted packaged build using the test encryption key. It will allow ATG to take captures to narrow down in specific areas. If you can’t supply a build, follow the steps in this paper to collect the best data to give to ATG.
The following data is always needed:
- Symbols for builds that generated captured data
- Preregistered users
- Either 20 or the maximum multiplayer game size, whichever is greater
- If looking at multiplayer, each account should have at least 20 friends
- Live SDK version
- xbconnect /d output while the title is running
- Windows version used in development
CPU issues
The two main trouble spots that show up with CPU issues are cache usage and threading usage. We recommend that captures are sent over for both types because they can be very closely related. All of the following captures should be taken in as similar locations as possible in your title. This will allow better correlation between the data.
Cache/Branching usage
Improper cache usage patterns can have a very detrimental effect on performance; access times for a cache miss are approximately 100x slower than a cache hit. Take a look at the following white papers for more details on the costs:
- Xbox One CPU: Introduction
- Xbox One CPU: Branch Prediction
- Cross-Core Memory Costs on the Xbox One CPU
PIX
The Performance Investigator for Xbox (PIX) is the only tool available for Xbox One that collects the required data to analyze cache and branch issues.
To capture data by using PIX:
- Start your title.
- Start PIX.
- Navigate to problem spots in your title.
- Use the Function Summary Capture command.
Figure 1. Function Summary Capture command. 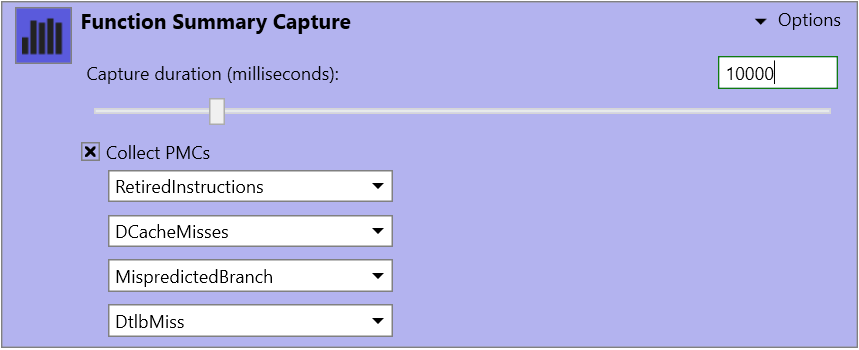
- Make sure you select the same options for Collect PMCs as shown in Figure 1.
- It’s preferable to make the duration as long as reasonable for your title.
- The major issue is that Function Summary Capture adds considerable overhead; in some cases the frame rate can drop to less than 1 frame per second.
- Save the collected data to disk for ATG.
Threading usage
Threading issues fall into several categories:
- Over-subscription to the CPU cores. There are at most 7 cores available for your title. For example, having 28 active threads will give each thread ~25% of a core for work.
- Heavy contention between synchronization primitives used by the threads. This can effectively turn the system into a single-threaded model.
- High context switch rate. The average cost per context switch is 2 microseconds. A large context switch rate can account for several milliseconds of your frame time.
Both PIX and Event Tracing for Windows (ETW) collect data that is very useful in tracking down the location of any threading issues.
PIX
To capture data by using PIX:
- Start your title.
- Start PIX.
- Navigate to problem spots in your title.
- Use the Timing Capture command.
Figure 2. Timing Capture command. 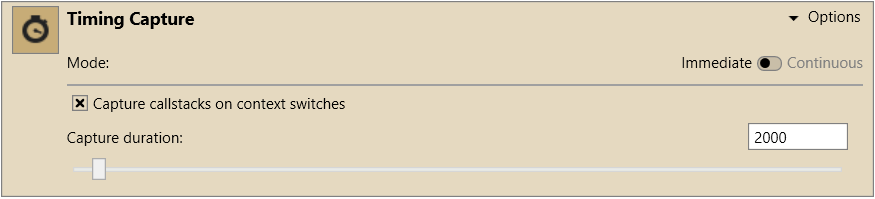
- Make sure that the Capture callstacks on context switches check box is selected.
- Save the collected data to disk for ATG, along with the matching symbol files.
Timing captures require PIX events/markers with enough granularity to determine where time is being spent, and as proper thread names are also important. This helps ATG to understand the flow of your engine and to narrow attention to specific hotspots within the title. It also helps your team to stay on top of any possible performance issues that may be introduced during day-to-day development. Specific tips:
- Watch out for unmatched PIXBeginEvent/PIXEndEvent pairs, which can cause all times reported for events to be attributed to the wrong section of code.
- PIXScopedEvent automatically closes its event when it leaves scope. This helps prevent issues during development as the code changes.
- Assign colors based on the major systems within the title.
- For example, red to animation, blue to physics, and green to lighting.
- Use fine granularity to help narrow down problem locations.
- A good rule of thumb is to use a granularity at the individual entity update level—for example, the animation update for each entity.
- Create descriptive names for each event.
- If possible, include specific asset names—for example, the name of the skeleton being updated during animation.
- Create events surrounding any spin loops.
- This helps determine how much “idle/stalled” time is being used by the thread.
- Create events for all sections of the title.
- For example, for simulation, render, worker system, and streaming system.
- Create names for all of the title created threads.
- SetThreadName in the XDK attaches the name to the Thread Information Block (TIB), which PIX and the title can read at any point by using GetThreadName.
ETW
Xbperf uses tracelog as its underlying collection mechanism, and tracelog is built on top of Event Tracing for Windows (ETW). ETW is built into the operating system at the driver level, which allows for very low-level data collection. Using tracelog directly allows fine-grained access to enable specific system events to reduce the overhead to acceptable levels.
To capture data by using ETW
- Start your title.
- Navigate to problem spots in your title.
- From an Xbox command prompt, execute the included CPU batch file.
- Wait for the Press any key to continue . . . to appear before starting to reproduce the problem.
- Collect for as long as needed to fully demonstrate the problem areas. In general, error on the side of a longer capture.
- Press any key to finish the capture and have it copied over to your PC.
- Bundle the saved file for ATG, along with the matching symbol files for your title.
- The default name is “ThreadData_merge.etl.”
File loading issues
All file loading data should be done by using an encrypted packaged build. You can create these by using the makepkg utility supplied with the XDK. Make sure that you use the /lt option to encrypt the package with a test encryption key. Without this step, the resulting data collected will not match the characteristics seen by your customers.
The steps for capturing data for both a level load pattern and a streaming pattern are similar. The only major difference is where you perform the capture in your title.
PIX
To capture data by using PIX:
- Start your title.
- Start PIX.
- Navigate in your title to the point just before loading starts; this may be before a large streaming operation.
- Use the File IO Trace command.
Figure 3. File IO Trace command. 
- Wait for PIX to respond with the Capture in progress dialog.
Figure 4. PIX Capture in progress dialog. 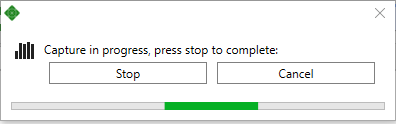
- Start the loading operation within your title.
- When loading is complete, select Stop in the dialog.
- If your title is constantly streaming data, capture for approximately 30 seconds while your title is under heavy load.
- Save the collected data to disk for ATG.
ETW
In some cases, there may be close relationships between general CPU usage and file loading performance. In these cases, it’s necessary to collect CPU data along with the matching file loading operation. Using the included file loading batch file is the best way to achieve this.
To capture data by using ETW:
- Start your title.
- Navigate in your title to the point just before loading starts; this may be before a large streaming operation.
- Start the included file loading batch file.
- Wait for the batch file to display Press any key to continue . . ..
- Start the loading operation within your title.
- When loading is complete, press a key to allow the batch file to finish collection.
- If your title is constantly streaming data, capture for approximately 30 seconds while your title is under heavy load.
- Bundle the saved data for ATG, along with the matching symbol files for your title.
- The default name is “FileData_merge.etl.”
Network traces
All network traces should be taken with the maximum number of users in a multiplayer session. Each user profile should have at least 20 friends. This will create a representative set of data to the average play session when running retail.
Security review
If your title is using a custom security solution (UDP/TCP) over insecure sockets to dedicated servers, a security review is needed. If your publisher has already obtained an exception, a security review can be skipped. For details, see the Xbox One Secure Communication Requirements white paper.
Fiddler
Fiddler is a web debugging proxy that logs all HTTP and HTTPS traffic between your Xbox One dev kit and the Internet. You will use it to log and inspect traffic to and from the Xbox services and relying party web services, to understand and debug web service calls.
In normal operation, a console that communicates through a proxy is at risk of having its communications modified by the proxy, possibly allowing players to cheat. Thus, consoles are designed to not allow communication through a proxy. Using Fiddler with your Xbox One dev kit requires that you perform some special configuration steps on the dev kit to allow it to use the Fiddler proxy.
Fiddler is freeware, and can be downloaded from the Fiddler website. You’ll find detailed instructions for using Fiddler in both UWP and Xbox One titles in Troubleshooting Xbox Live using Fiddler. Alternatively, for Xbox One titles, follow the instructions in the next section.
Setup
To install and enable Fiddler to monitor traffic from your dev kit:
- Install Fiddler on your development PC, following the directions on the Fiddler website.
- Launch Fiddler and select Fiddler Options from the Tools menu.
- Select the Connections tab, and ensure that the Allow remote computers to connect check box is selected.
- Click OK to accept your changes to the settings. You will see a dialog box saying that Fiddler must be restarted for the change to take effect, and that you may need to configure your firewall manually. Click OK, but do not restart Fiddler yet.
- Configure the necessary firewall rule to allow remote computers to connect. Start the Windows Firewall Control Panel applet. Click Advanced Settings, and then click Inbound Rule. Find the rule named FiddlerProxy and scroll to the right, verifying that each of the following settings appears for that rule.
| Setting | Preferred Value |
|---|---|
| Name | FiddlerProxy |
| Group | (do not set a value for Group) |
| Profile | All |
| Enabled | Yes |
| Action | Allow |
| Override | No |
| Program | path to fiddler.exe |
| LocalAddress | Any |
| RemoteAddress | Any |
| Protocol | TCP |
| LocalPort | Any |
| RemotePort | Any |
| AllowedUsers | Any |
| AllowedComputers | Any |
- Configure Fiddler to capture and decrypt HTTPS traffic.
- To enable best performance, set Fiddler to use Streaming Mode by clicking Stream on the button bar.
- In Fiddler, select Tools > Fiddler Options > HTTPS.
- Select the Decrypt HTTPS traffic check box. If a message asks whether to configure Windows to trust the CA certificate, click No.
- Click Export Root Certificate to Desktop.
- Exit Fiddler and start it again.
- Copy the Fiddler root certificate that you exported to the desktop to the dev kit as xs:\Microsoft\Cert\FiddlerRoot.cer.
- Create a text file named ProxyAddress.txt, with the IP address or hostname of the development PC running Fiddler and the port number where Fiddler is listening as the only content in the file. Format the name/IP address and port as follows: HOST:PORT (by default, Fiddler uses port 8888). For example, “10.124.220.250:8888” or “my_dev_pc.contoso.com:8888”
- Copy this file to the dev kit as xs:\Microsoft\Fiddler\ProxyAddress.txt.
- Restart the dev kit.
Captures
To capture data by using Fiddler:
- Start a capture from Fiddler on the PC.
- Start your title.
- Navigate through menu items that access services for player data.
- Start a multiplayer game session with the maximum number of players.
- Play through at least one full multiplayer game.
- Shut down your title.
- Stop the Fiddler capture.
- Bundle the saved data for ATG, along with the matching symbol files for your title.
Xbox Live Trace Analyzer
After a Fiddler capture is available, title developers can self-diagnose Xbox Live service call patterns by using the Xbox Live Trace Analyzer (LTA) tool. This tool parses a Fiddler trace and looks for incorrect calling patterns that will cause issues for the title or Xbox Live Services.
The Xbox LTA tool download and runtime instructions are available online. We highly recommend that title developers run this tool and review the output.
Recommendations
Always work with your Developer Account Manager when you want to engage ATG for help in locating performance issues. They will be able to provide you with a wealth of resources that may help you solve your issues before escalation.
Following the provided steps over a representative section of your title will provide the best data for ATG. If possible, create multiple captures for both a performant steady state along with trouble spots for comparison. When in doubt, always err on the side of more data.
Summary
Quality performance data is vital when working with ATG, and this will allow them to recommend the best solutions for any issues they find. The first thing ATG will ask for are similar captures to the ones provided here. By following the steps provided, you will get ahead of the curve and allow ATG to help you more quickly.
Appendix A: Batch files
CPU
      echo OFF
      REM Use the name on the command line for the capture or use the default
      set ETWName=%1
      if "%1"=="" set ETWName=ThreadData

      set SavePath=d:\
      xbdir /x/title xd:\profile > NUL
      if %ERRORLEVEL% EQU 0 set SavePath=%SavePath%profile\

      REM Start the capture on the default Xbox
      xbrun /x/title /O tracelog -start %ETWName% -f %SavePath%%ETWName%.etl -eflag
      DISPATCHER+PROC_THREAD+PROCESS+THREAD+VIRT_ALLOC+LOADER+CSWITCH+PROFILE -stackwalk PROFILE+CSWITCH+VIRT_ALLOC+READYTHREAD

      REM Wait for the user to press a key when the session has finished capturing
      PAUSE

      REM Stop the capture, merge the file to resolve events, finally copy the etl file over to the PC
      xbrun /x/title /O tracelog -stop %ETWName%
      xbrun /x/title /O tracelog -merge %SavePath%%ETWName%.etl %SavePath%%ETWName%_merge.etl
      xbcp /x/title x%SavePath%%ETWName%_merge.etl
      start %ETWName%_merge.etl
File loading
      echo OFF
      REM Use the name on the command line for the capture or use the default
      set ETWName=%1
      if "%1"=="" set ETWName=FileData

      set SavePath=d:\
      xbdir /x/title xd:\profile > NUL
      if %ERRORLEVEL% EQU 0 set SavePath=%SavePath%profile\

      REM Start the capture on the default Xbox
      xbrun /x/title /O tracelog -start %ETWName% -f %SavePath%%ETWName%.etl -eflag
      PROC_THREAD+LOADER+FILENAME+DISK_IO+DISK_IO_INIT+INTERRUPT+CSWITCH+PROFILE -stackwalk PROFILE+CSWITCH+DiskRead+DiskWrite+DiskFlush

      REM Wait for the user to press a key when the session has finished capturing
      PAUSE

      REM Stop the capture, merge the file to resolve events, finally copy the etl file over to the PC
      xbrun /x/title /O tracelog -stop %ETWName%
      xbrun /x/title /O tracelog -merge %SavePath%%ETWName%.etl %SavePath%%ETWName%_merge.etl
      xbcp /x/title x%SavePath%%ETWName%_merge.etl
      start %ETWName%_merge.etl