PIX Settings page
The PIX Settings page contains the following groups of options: GPU Capture, Timing Capture, CPU Captures, Timeline, Symbol/PDB Options, and General.
Opening the Settings page
To open the Settings page: In the PIX window, click the FILE tab/menu, then along the left side of the window, click Settings.
Figure 1. The Settings page:
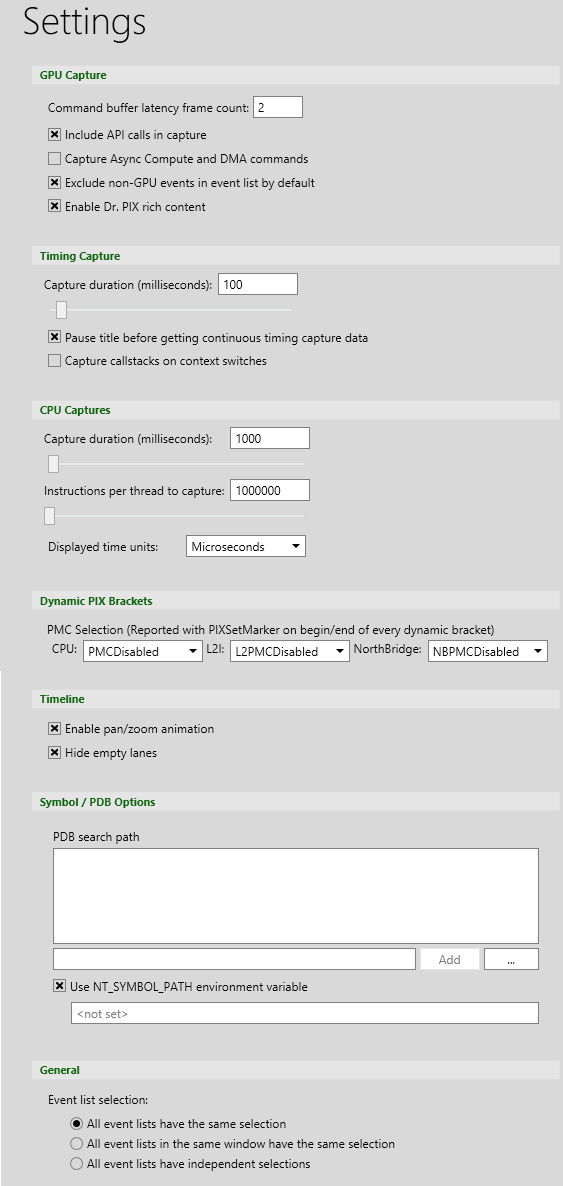
Description of each PIX setting in the Settings page
“GPU Capture” section
| Option |
Default |
Description |
| Command buffer latency frame count |
2 |
When API calls are made on a deferred context, a CommandList is created containing the work of those API calls. Sometime later, the application will execute this CommandList on the immediate context. The number of frames between the first API call that goes into a CommandList and the execution of the command list on the immediate context is referred to as the “Command Buffer Latency Frames”. The “Command Buffer Latency Frames” option allows you to specify the number of latency frames that are used by your application for “short life” CommandLists (command lists which are created within a few frames of the usage, typically 1 to 3). By increasing this value to accommodate the command list lifespan, PIX can capture full API data for these CommandLists, including shader usage. If the value is too short, command lists which were started before the specified lifespan will be captured, but full API call information and some features such as HLSL shader source will not be available for the calls inside that command list. If the value is set high, your captures will take longer and will capture a later frame. For example, setting a value of “60” on a title which is running at 60 FPS will introduce a one second lag between the capture command, and the frame which is actually captured. |
| Include API calls in capture |
Enabled |
Uncheck this only if a GPU capture fails. Without API call information, the results are more difficult to interpret. |
| Capture Async Compute and DMA commands |
Disabled |
Captures include asynchronous compute and direct memory access (DMA) events. |
| Exclude non-GPU events in event list by default |
Enabled |
Controls whether !G is enabled or disabled in the event list by default. |
| Enable Dr. PIX rich content |
Enabled |
Enables the new Dr. PIX bottleneck analysis, and new layouts for existing experiments. |
“Timing Capture” section
| Option |
Default |
Description |
| Capture duration |
100 |
Timing capture duration in milliseconds. |
| Pause title before getting continuous timing capture data |
Enabled |
Automatically pause the title for continuous timing captures. A continuous timing capture runs for a selected interval, pausing may add better predictablitiy to the timing of the interval. |
| Capture callstacks on context switches |
Disabled |
Indicates that callstacks should be captured for context switches while taking timing captures. |
“CPU Captures” section
| Option |
Default |
Description |
| Capture duration |
1000 |
Summary capture duration in milliseconds. |
| Instructions per thread to capture |
1000000 |
The number of instructions to capture when an instruction trace capture is initiated from the HOME tab. |
| Displayed time units |
Microseconds |
The unit of time displayed in CPU profiling captures. Valid values are: Microseconds, Milliseconds, Nanoseconds and CPU_CLOCKS. |
“Memory Allocation Captures” section
| Option |
Default |
Description |
| Displayed size units |
Kilobytes |
Enables users to choose the units displayed in memory captures. Refer to PIX Memory Captures. |
“Dynamic PIX Brackets” section
| Option |
Default |
Description |
| PMC Selection (Reported with PIXSetMarker on begin/end of every dynamic bracket) |
PMCDisabled, L2PMDisabled, NBPMCDisabled |
Determines the performance monitoring counters to get data on. Refer to PIX Customizing Timing Captures and PIXSetMarker. |
“Timeline” section
| Option |
Default |
Description |
| Enable pan/zoom animation |
Enabled |
Disable the animations if your machine has a slower video card, or you are running on a remote desktop, to avoid a slow or choppy response. |
| Hide empty lanes |
Enabled |
If enabled, unused timelines are not displayed. |
“Symbol / PDB Options” section
| Option |
Default |
Description |
| PDB search path |
Left blank |
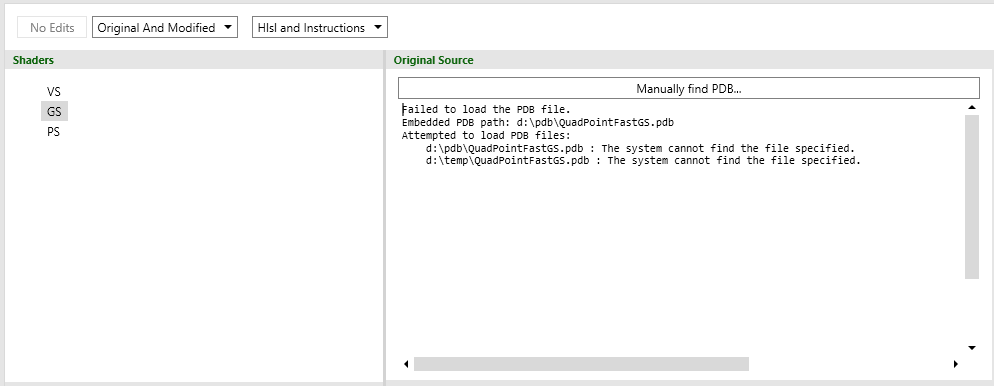
This is the PDB search path that PIX will use to locate the symbols (function names) for both the PIX Function Summary Captures feature, and shader PDBs. If this is left blank, PIX will look in the default locations for PDB files, so normally an entry is not needed here. If, however, the PDB file is in some custom location, then add the path here. The default location for a PDB file is a path embedded in the app or dll at link time. PIX will use the _NT_SYMBOL_PATH environment variable, if the check box is set, which is a Microsoft standard mechanism for locating symbols. In the Shaders view, information about the PDB locations that were previously attempted, and their reason for failure, are shown (see the screen capture below). |
| Use NT_SYMBOL_PATH environment variable |
Enabled |
See the description for PDB search path. |
“General” section
| Option |
Default |
Description |
| Event list selection |
All event lists in the same window have the same selection |
Options for the effect of selecting event lists. |
The Shaders view for PDB files that didn’t load
If PDB files fail to load, the Shaders view appears as follows.
Figure 2. Failing to load PDB files:
See also
PIX options and layout
PIX