PIX Resource Browser
- Resource Browser
- Color Histograms
- ESRAM residency
- Show data before draw
- Visualizations
- The Info Panel
Resource Browser
The Resources tab defaults to showing just the range of resources available. For many apps the first resource to check is Render Target 0, the actual image produced by the frame. Other render targets such as the depth and stencil buffers can be selected for viewing, along with the shader resources used to create the frame. Currently the depth buffer view works by hovering the mouse pointer over a point and the depth value will appear above the image.
Resources that are bound but unused are displayed with a lighter font color. This helps distinguish the relevant resources in cases where game code leaves several resources bound to the pipeline over a series of draws.
The Resource Browser only displays the portion of a resource which is accessible through the bound view. PIX GPU captures generally only have visibility into resource views as the GPU sees them. For example, if a render target view maps one slice of an array texture as a single 2D texture, the PIX UI will not show or provide awareness of the other slices.
Figure 1. Render target 1. Note the color histogram.
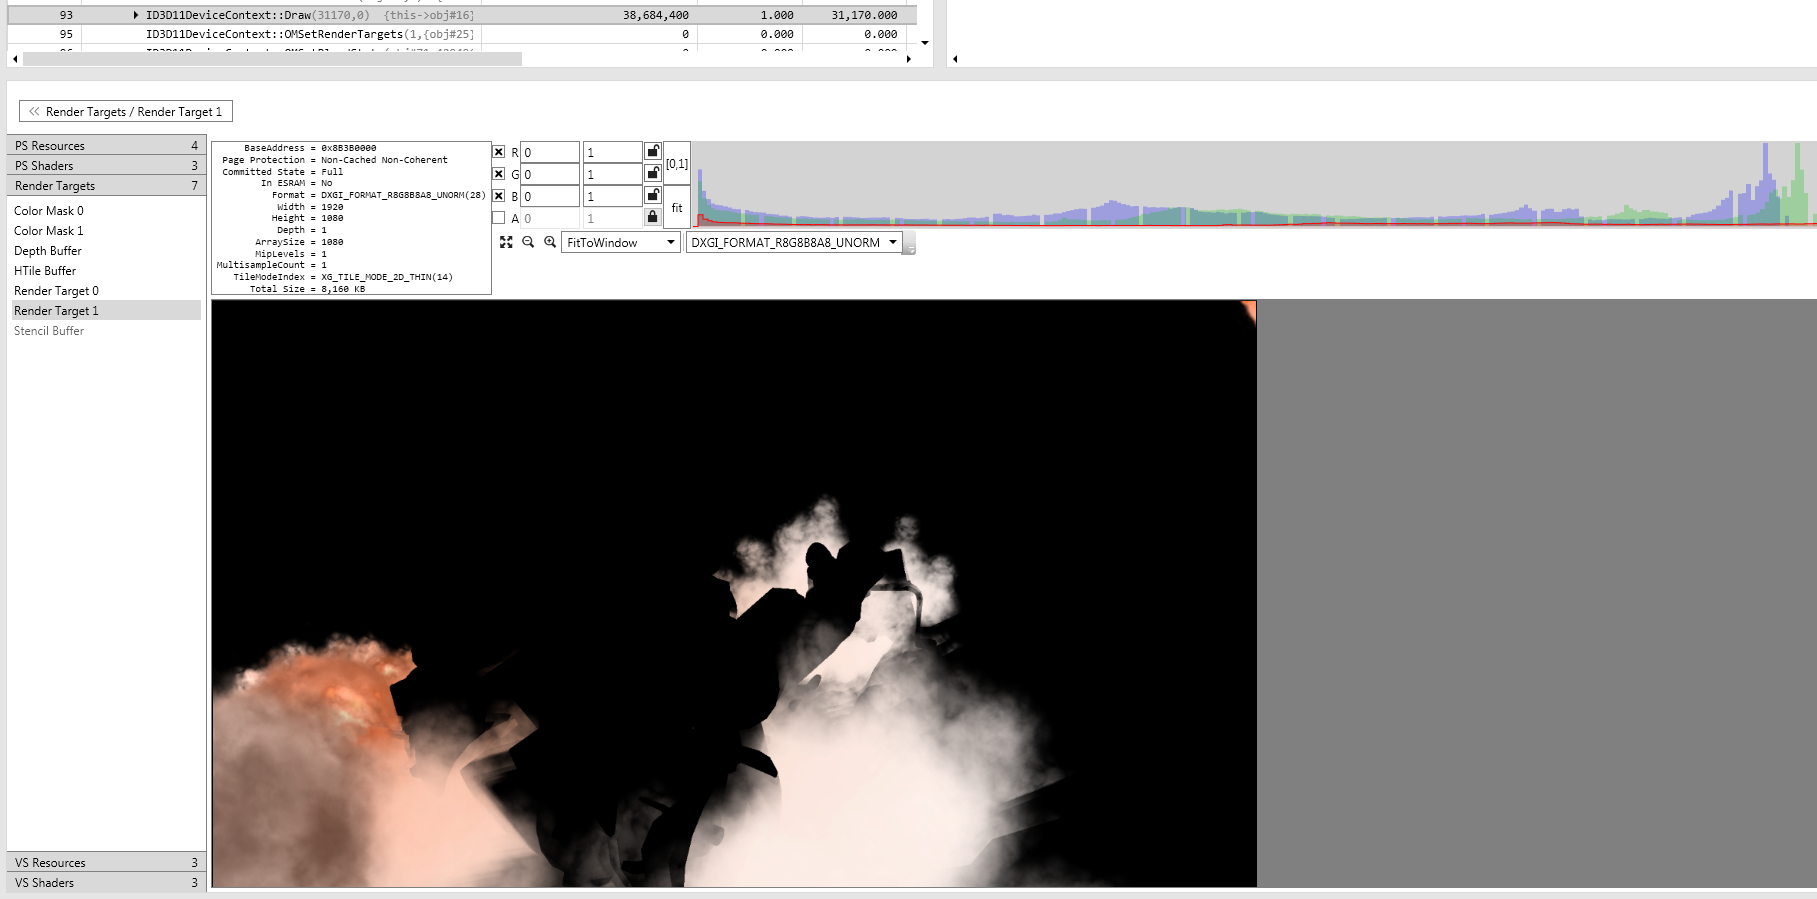
Figure 2. PS Resources / Texture 0. One of the explosion/smoke textures.
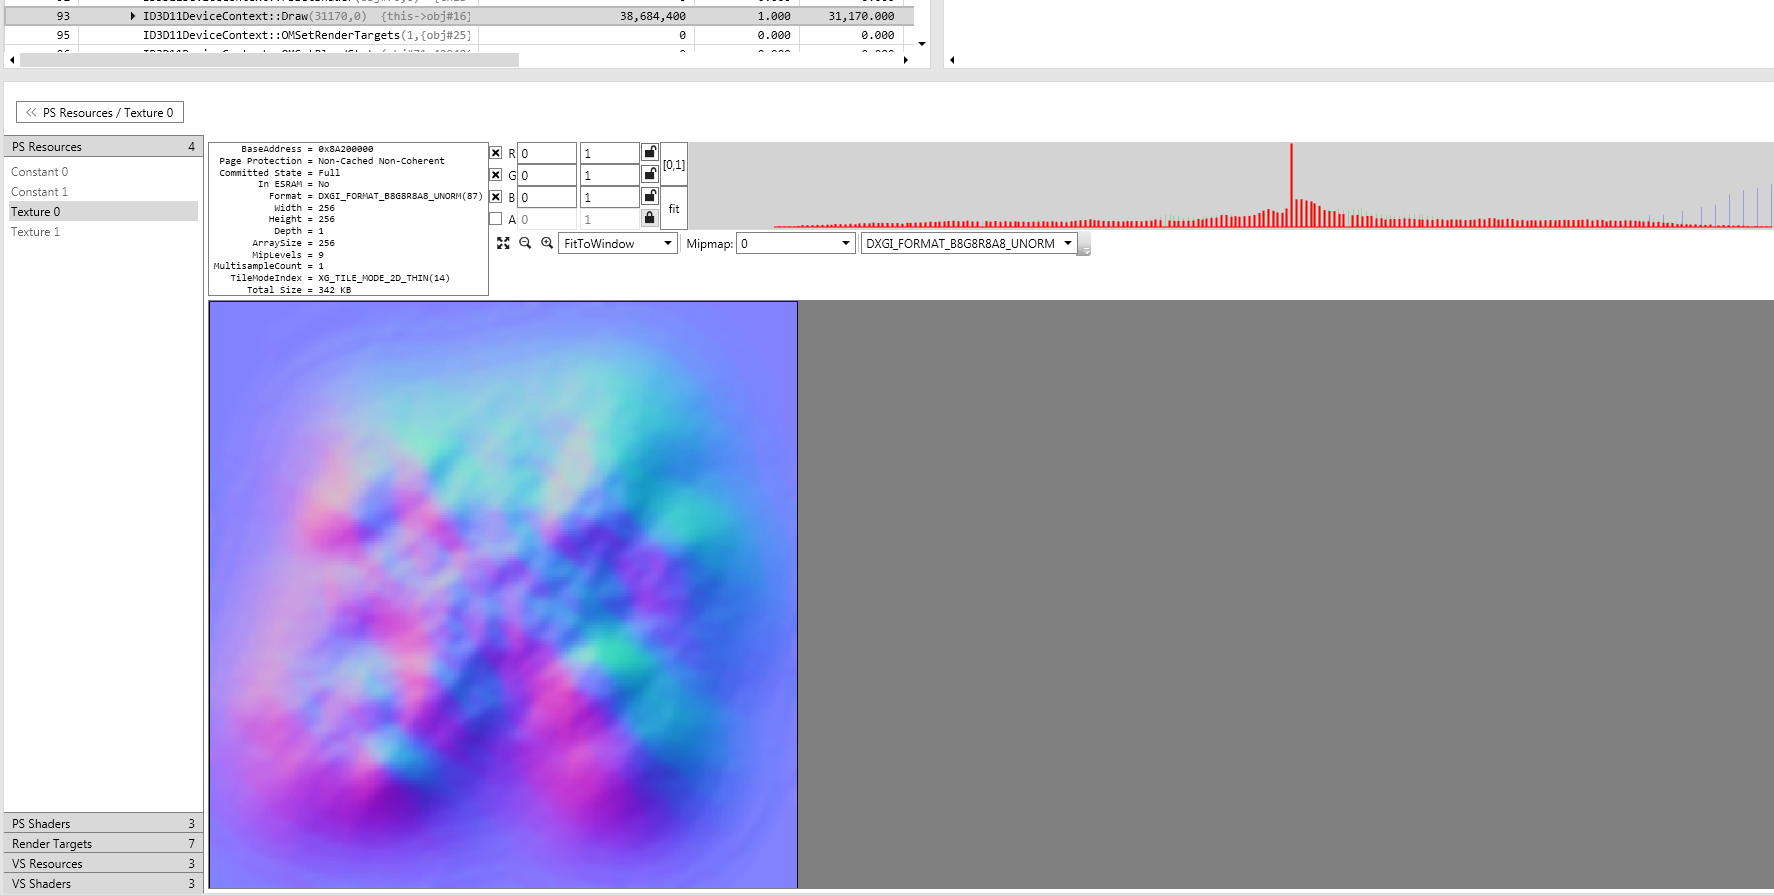
Figure 3. VS Resources / Vertex Buffer 0.
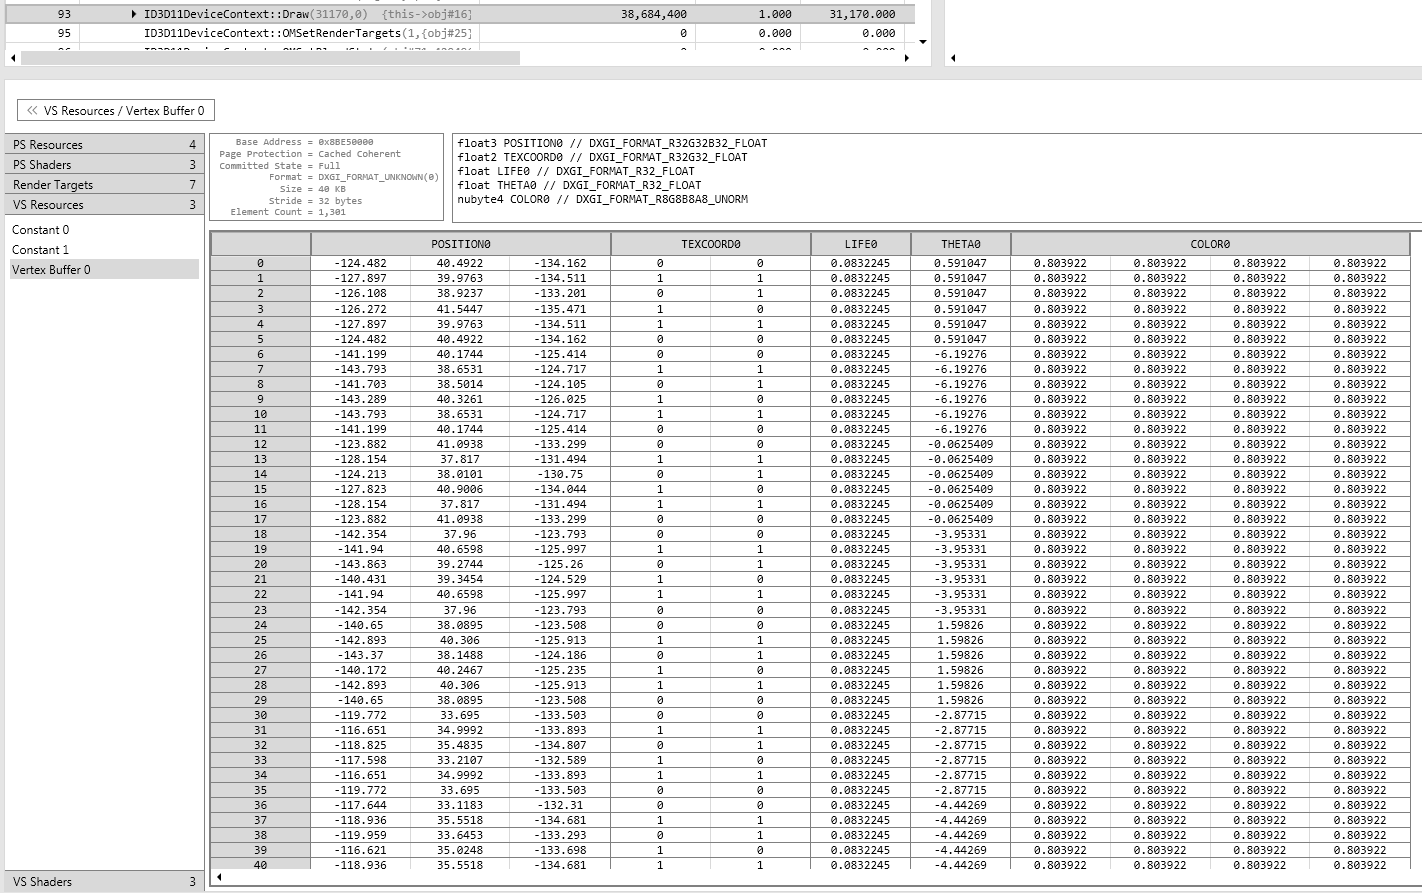
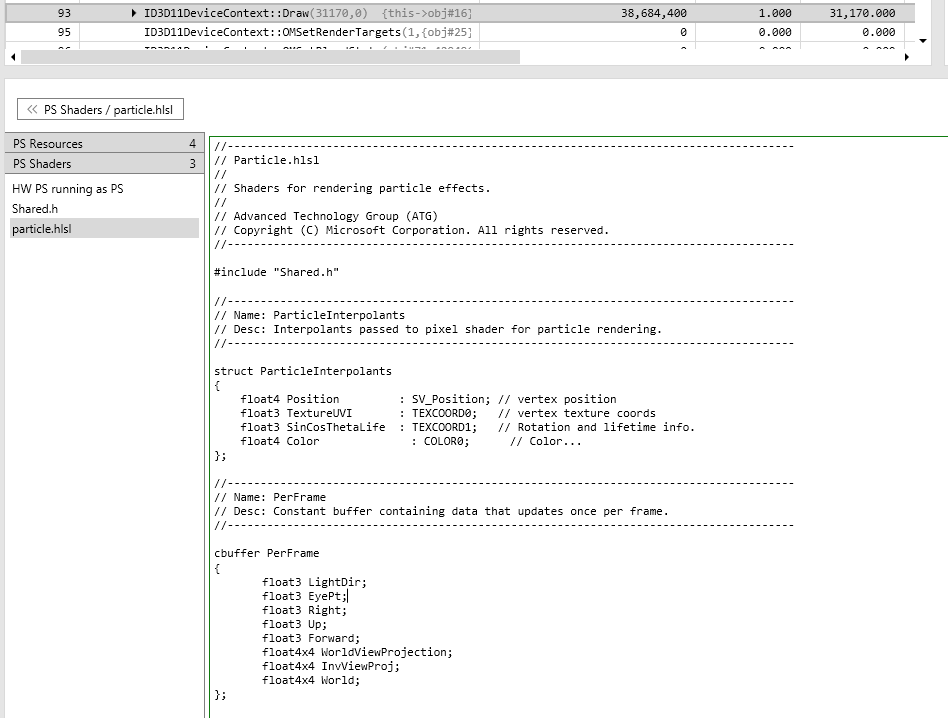
Figure 4. Shader source code for the selected draw call can also be displayed.
Color Histograms
Color histograms can be displayed for the Render Targets, Depth and Stencil buffers, and also Textures.
Varying the bounds of these histograms can be helpful to control the range of color values displayed for a resource. Just as with image editing tools, sometimes it is useful to isolate the spectrum of colors you are looking at to better analyze the data visually. In particular, some formats don’t span the full spectrum so users need to manually correct that in the histogram so the display is meaningful.
Figure 5. The RGBA components of the image can be selected individually or in combinations.
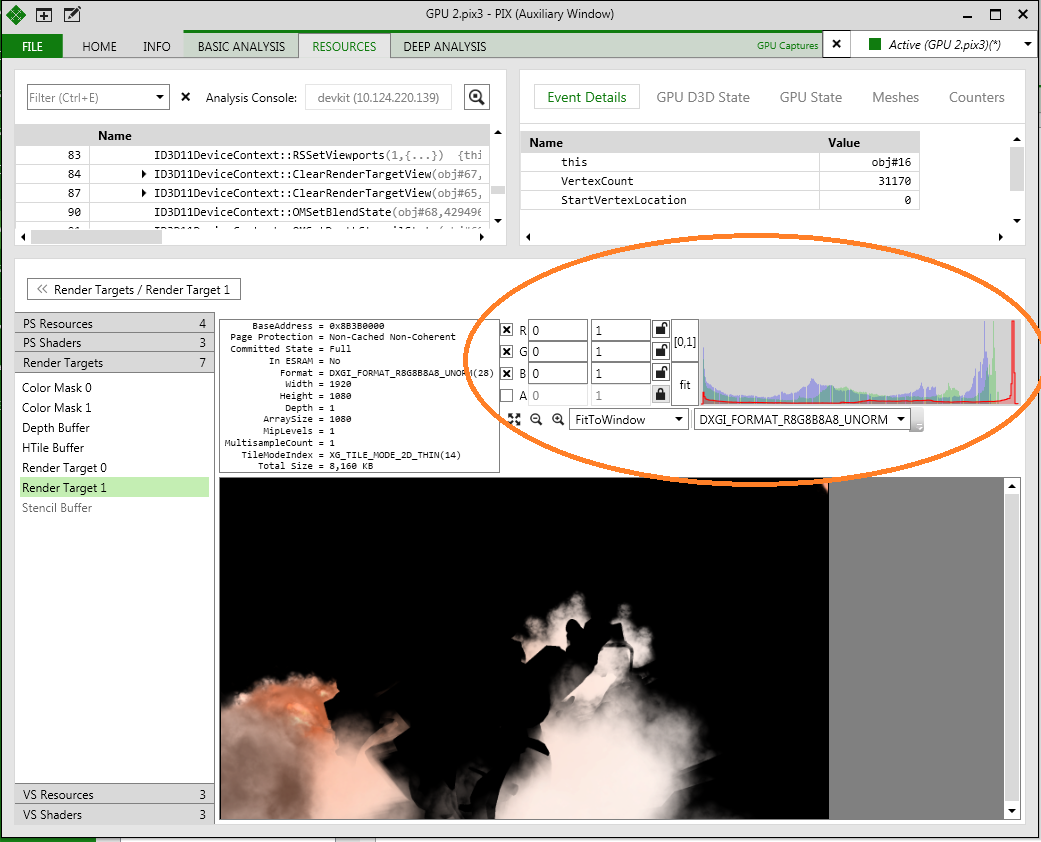
Figure 6. The green channel of the image.
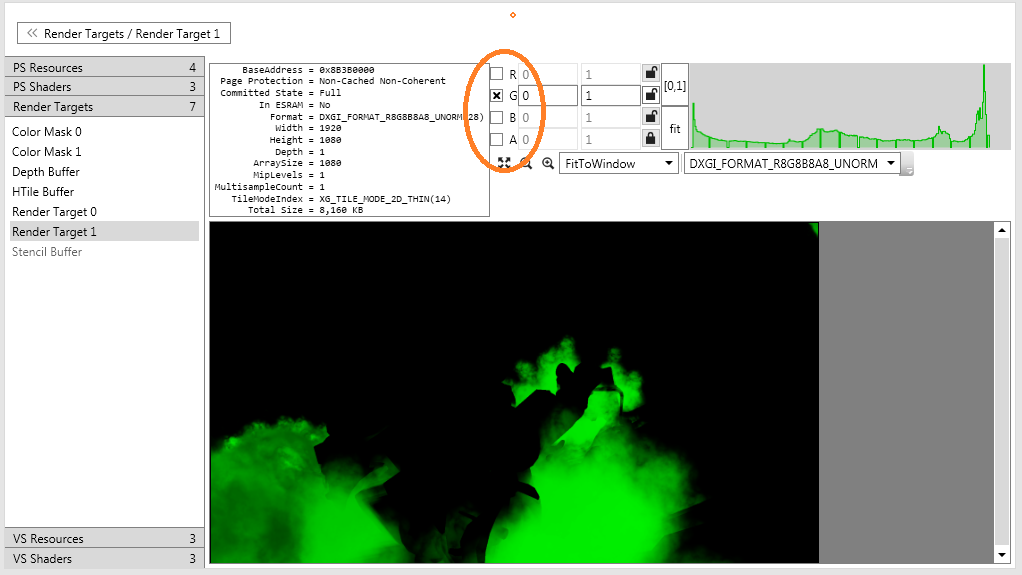
Figure 7. The green channel scaled from 0.5 to 0.75.
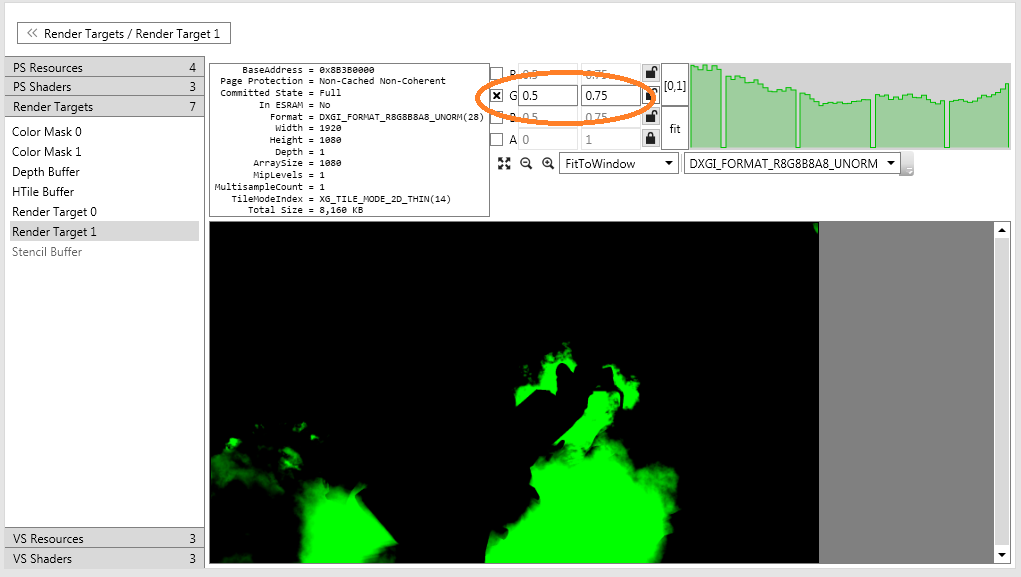
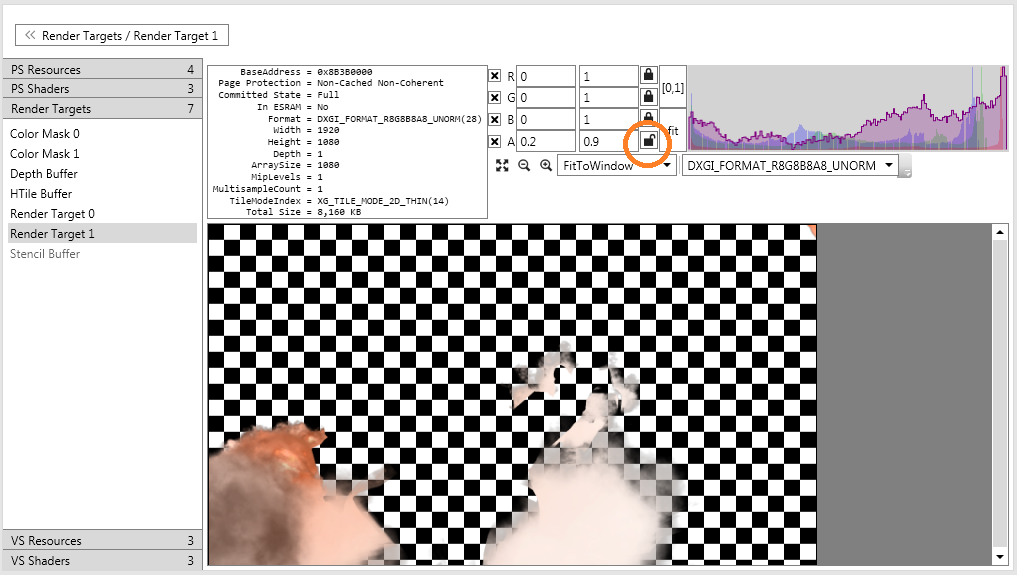
Figure 8. Locked red, green and blue channels, with the alpha channel unlocked, scaled from 0.2 to 0.9.
ESRAM residency
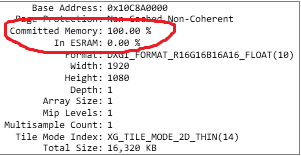
To help optimize use of ESRAM, two percentages are shown for buffer, texture or render target resources. The Committed Memory percent is calculated as:
number of committed bytes/total bytes * 100
The In ESRAM percentage is calculated as:
number of bytes in ESRAM/total bytes * 100
To view these values, open any PIX capture, select a draw call, open up the Resource Browser and then select the resource to view. There is no need to start an analysis. The following image shows an example of the display.
Figure 9. ESRAM residency for a resource
Show data before draw
Use the Show data before draw toggle to show the state of the current resource before or after the current draw. This is useful in understanding how a given draw affected a resource without having to hunt through the events list for the last draw event that touched that resource.
Visualizations
There are currently six built in visualizations:
- Image: Shows the currently-selected render target as an image with no visualizations applied.
- Wireframe: Draws a wireframe version of the currently-selected draw event on top of the scene. Useful for identifying the parts of a render target that were affected.
- Overdraw: Shows the overdraw for the render target, which calculates how many times a pixel was touched by the current draw event.
- Depth complexity: Shows the number of pixels that had the depth test applied. Similar to overdraw but also includes the cost of depth processing.
- Pixel cost: Shows how long a pixel took to draw.
- ESRAM: Shows which portions of a render target are in ESRAM or DRAM.
In addition to the built-in visualizations, you can add custom visualizations to the drop-down in the UI. There are two custom visualizations provided as examples with the tool:
- NANandINF
- Tonemap
Refer to PIX Custom Visualizations for more details.
The Info Panel
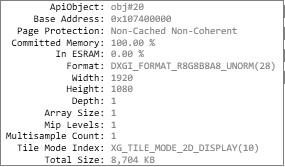
The information panel (example shown in the image below) provides basic information about any resource. The following table describes each field.
Figure 10. The Info Panel
| Member | Description |
|---|---|
| ApiObject | Reference name of the object displayed in Events and Event Details views. |
| Base Address | Virtual memory base address. |
| Page Protection | One or more of: Cached/Non-Cached, Coherent/Non-Coherent. |
| Committed Memory | Percentage of memory committed by memory manager. |
| In ESRAM | Percentage of memory resident in ESRAM. |
| Format | One of DXGI_FORMAT: the format of the resource. Or one of extended format set using thej ID3D11ShaderResourceView::SetFormatX API. |
| Width | Width in pixels. |
| Height | Height in pixels. |
| Depth | Depth in pixels (not bits). |
| Array Size | Number of objects if in an array, 1 otherwise. |
| Mip Levels | Number of mipmap levels. |
| Multisample Count | Ratio of the number of pixels in the resource to the number of rendered pixels. |
| Tile Mode Index | Format and number of the tile. |
| Total size | Size in bytes of the resource. |