Debugging Xbox One Projects
This section describes the options available for general debugging of Xbox One projects. For graphics debugging and diagnostics, the primary tool is PIX.
If you don’t have the Visual Studio project on your PC, use the Aumid Override property.
You can also use the Debug Installed App Package dialog to debug any title installed on the dev console without the corresponding Visual Studio project. Additionally, you can use it to debug your protocol activation handler and debug under the currently logged in user.
For general debugging, use the following tool:
Visual Studio Debugger
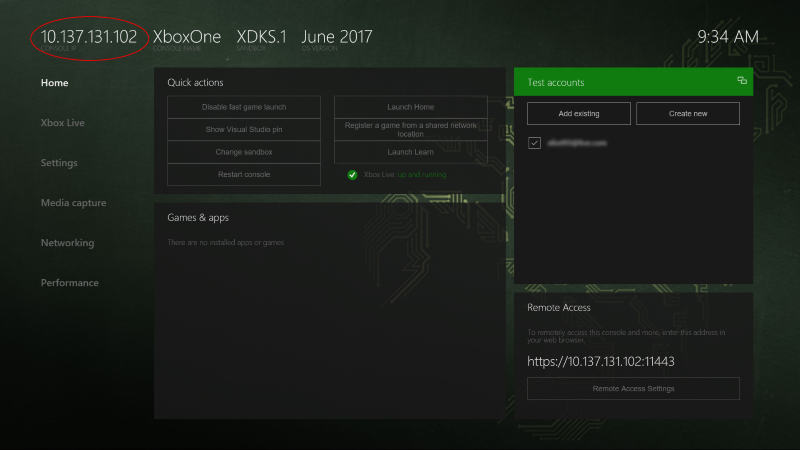
To use the normal methods of debugging available in Visual Studio, simply ensure that you are using one of the Xbox One templates described in Project Templates in Visual Studio for Xbox One Development, and then set Remote IP Address in the project properties (Configuration Properties > Xbox One > General, as shown in Figure 1). This should be set as the console IP address of the dev kit, which you can find in Dev Home (see Figure 2).
Note that there is no need to specify an IP address if you intend to use the default IP address that has previously been set using Connect (xbconnect.exe). Just leave the field blank in this case.
Figure 1. Set Remote IP Address to specify the console IP address of the dev kit.
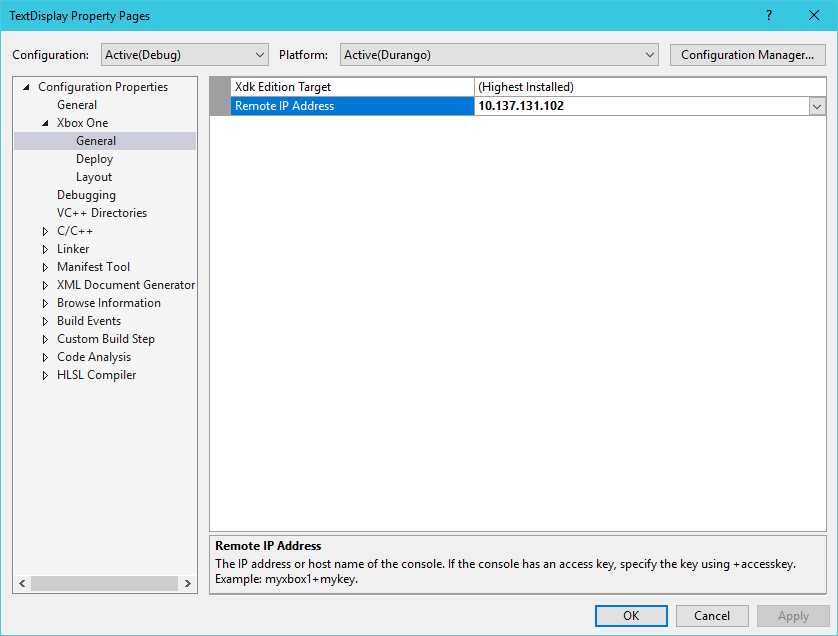
Figure 2. Launch Dev Home on your dev kit from Xbox One Manager on your PC. The Console IP is in the top left of the screen.
If you are using an Xbox One X dev kit, you can use the Debug NIC to test your title in “Disconnected Network” scenarios. In this case, you would use the Debug IP as the IP address to connect to with Visual Studio. See Using the Xbox One X Dev Kit 2nd NIC for more information.
Alternatively, you can attach the debugger to a process.
To attach the Visual Studio debugger to a running process
- Run your application on the Xbox One console.
- Open Visual Studio on the development PC, ensuring that the Xbox One XDK is installed.
- In the Debug menu, click Attach to Process…
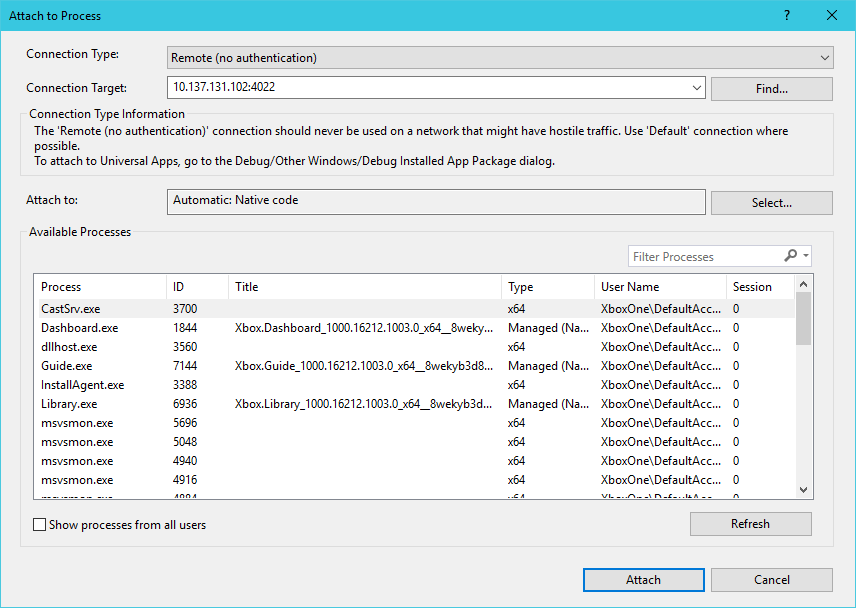
The Attach to Process window appears. - In the Connection Type dropdown, select Remote (no authentication).
- In the Connection Target box, type the Console IP address of the dev kit, and then click Find.
- Find the process that you want to attach to in the list under Available Processes, click it, and then click Attach. If you don’t see your application, try clicking Refresh.
Figure 3. Attaching to a process.
Include symbols in Visual Studio
A range of debugging symbols is shipped along with the Xbox One XDK, including for the application model, the graphics driver, Direct3D graphics extensions such as xg, XAudio2, and other system symbols.
To include the symbols in your Visual Studio debugging, complete the following procedure.
To include the Xbox One XDK symbols in Visual Studio
- Open Visual Studio.
- Select Tools > Options…
- Expand Debugging and select Symbols.
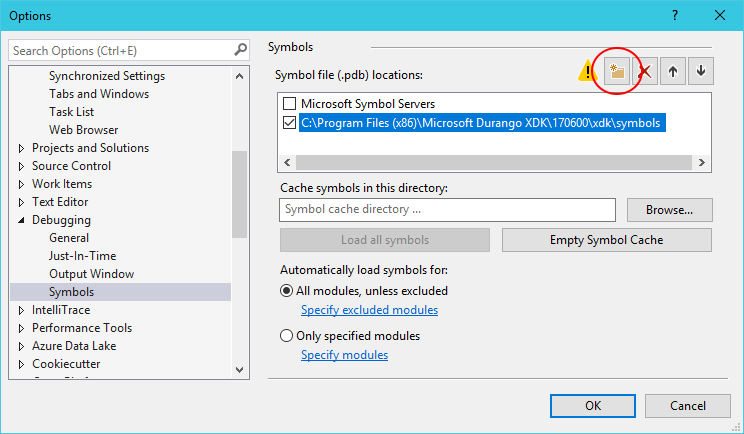
- On the Symbols page, click the Add Folder button (shown in the image below) to the right of Symbol file (.pdb) locations.
Clicking the Add Folder button adds a new and editable item in the box under Symbol file (.pdb) locations. - Type, or copy and paste, the following path into the newly created item under Symbol file (.pdb) locations. Remember to replace version_number with the version number of your XDK installation.
C:\Program Files (x86)\Microsoft Durango XDK\version_number\xdk\symbols Note This is the correct path for a typical installation. The location of the Xbox One XDK may be different on your computer.
 - Click OK.
Figure 4. The Add Folder button is circled in the image below.
See also
Launching a Title for Debugging Using the Aumid Override Property