PIX Timing Captures
Overview
PIX timing captures record information about when each piece of work was carried out by the CPU and GPU. This data is gathered in realtime while the game is running, and with minimal overhead, so you can see things like how work is distributed across CPU cores, the latency between graphics work being submitted by the CPU and executed by the GPU, and how GPU rendering workloads are overlapping with async compute.
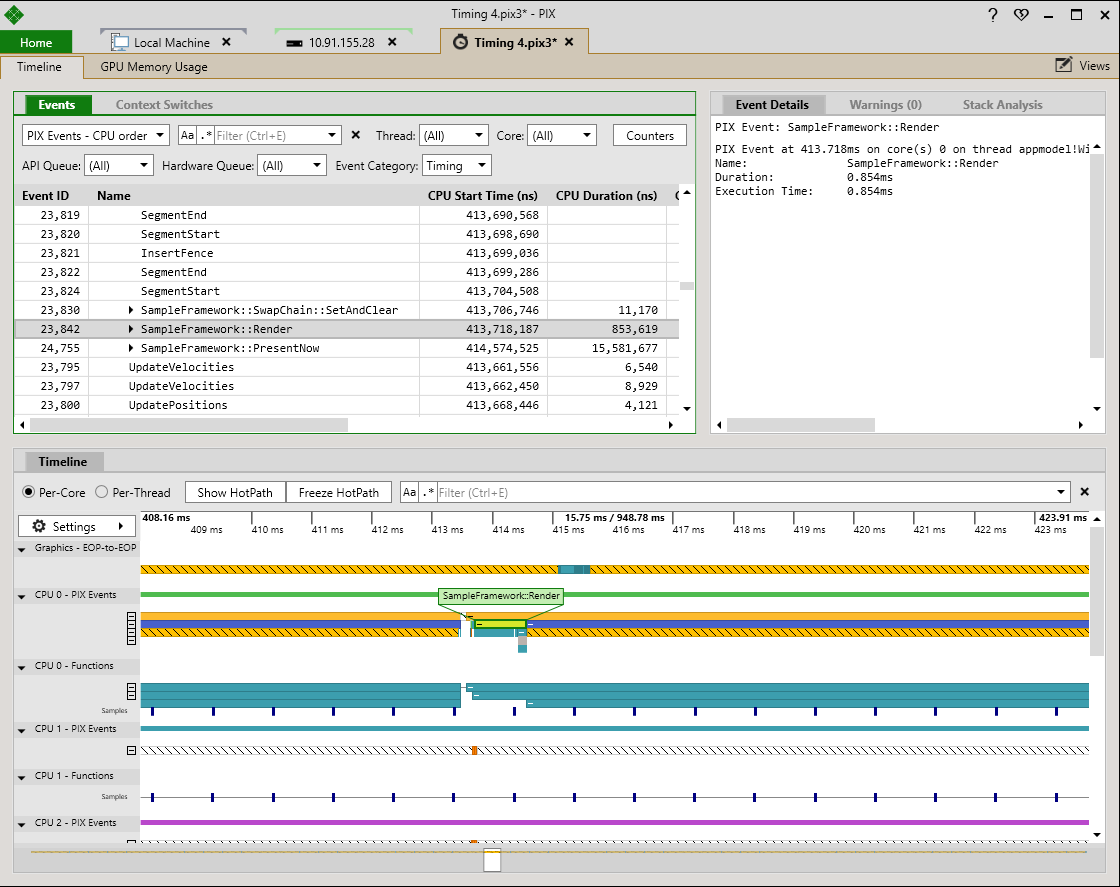
Timing captures display time-oriented data from a variety of sources both from within your title and from the system itself. Data from the instrumentation you’ve added to your code using PIX events and PIX markers will always be displayed. PIX can also optionally capture callstacks for context switches, CPU samples and functions defined in your title. These additional types of data enable additional profiling scenarios, but enabling these options increases the overhead of collection.
Capture Process
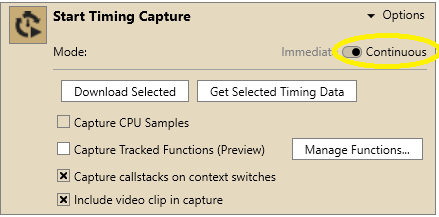
Timing captures support multiple ways to capture. By default, timing captures are taken as continuous captures and are integrated with the System Monitor. To start or stop a continuous timing capture press the icon next to Start Timing Capture after setting the mode to Continuous:
Once the capture is stopped a green range will appear on the System Monitor control, which allows selection of the range of timing capture data to open:
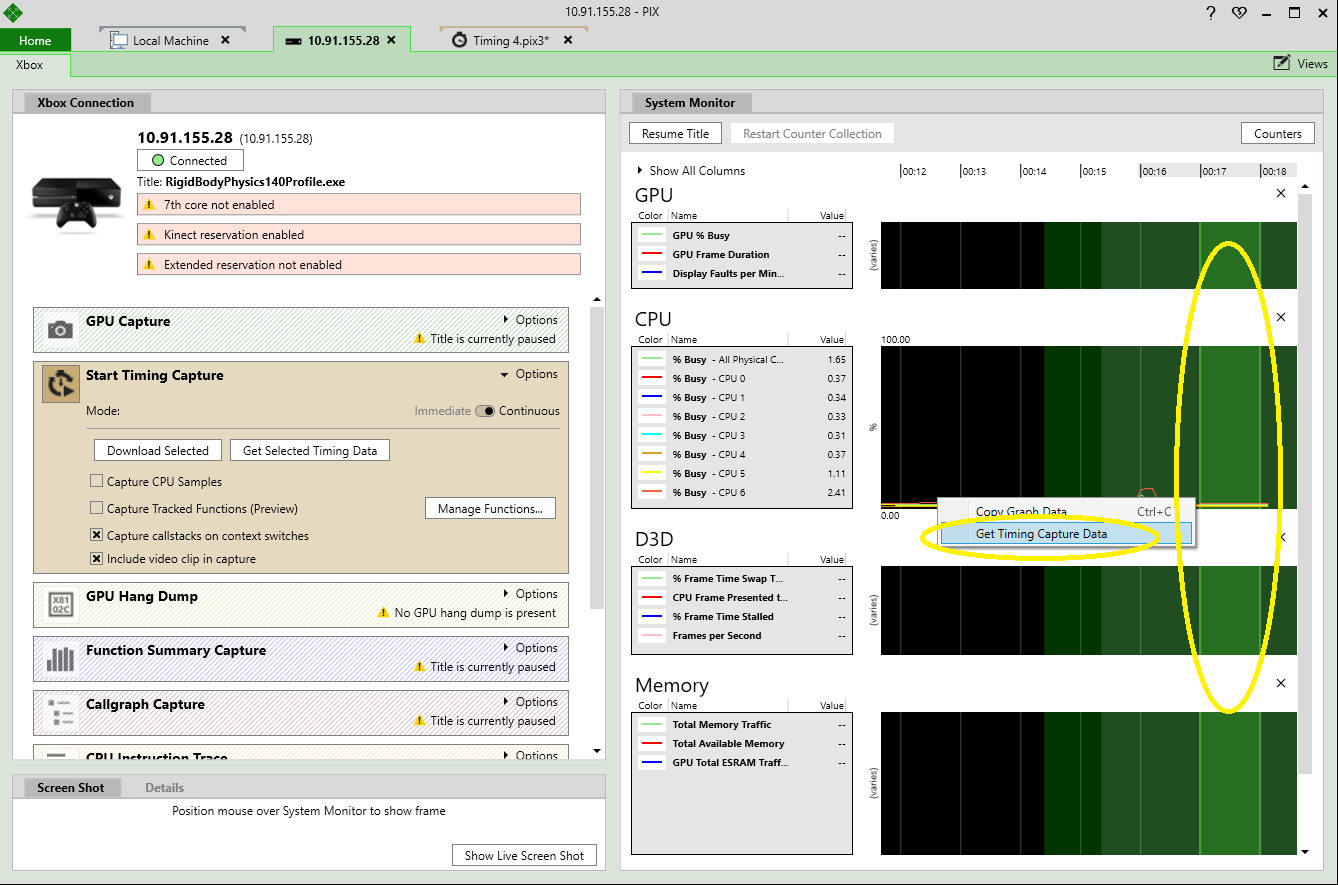
The range of timing data that can be opened is currently limited to 2 seconds.
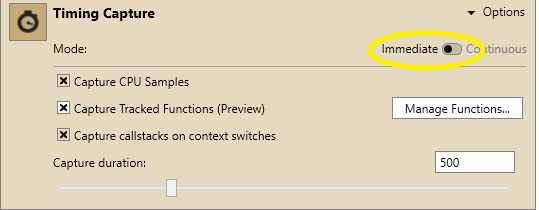
The other option for capturing timing data is through an immediate mode capture which starts, stops and then opens the timing capture after pressing the icon next to Timing Capture:
Timeline
The Timeline has two different ways to view lanes. The per-core view shows a hardware perspective by visualizing the available cores and GPU hardware. The per-thread view shows an API perspective by visualizing the per-thread activity of an application for the CPU and the execution of GPU work command queue. Use the radio buttons in the upper left corner of the Timeline to switch bewteen the per-core and per-thread views.
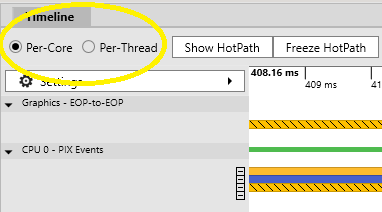
PIX will draw one Event lane per-thread or core to display PIX events and another Function lane per-thread or core to display CPU samples and tracked functions.
The SetThreadName API can be used to label your threads so they are easier to identify in the timeline
Scheduler Lane
PIX Timing Capture also includes a CLK lane, which visualizes GPU scheduler timing data. This lane displays events for Vertical Blanks, Flips, and GPU System Reservation.
During a GPU System Reservation, the title’s GPU processing is interrupted and the system has exclusive usage of the GPU. GPU duration and visualization for PIX events interrupted during a GPU System Reservation will include the duration of the GPU System Reservation call, which may be misleading. For example, from a running title the image below shows a PIX event for the method ExecuteCommandList. The GPU duration for this event is indicated as 2.9ms, but as this includes the ~1.67ms for the GPU System Reservation, the ExecuteCommandList actually only executed on the GPU for 1.23ms.
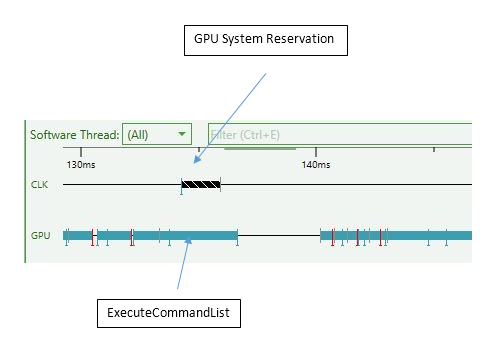
Also refer to the Timeline Legend below, showing that the black bar with a cross-hatch normally represents a system event.
Timeline Legend
The type of line shown in the timing capture indicates the source of the timing event.
| Display | Description | Represents |
|---|---|---|
 |
Flat line | CPU or GPU idle time. |
 |
Flat color bar | PIX event block (the color is specified by the title) or function block. |
 |
White bar with cross-hatch | Execution time on a title thread that was outside the scope of any PIX event. |
 |
Black bar with cross-hatch | Execution time on a non-title thread (generally system execution). |
 |
Orange bar with cross-hatch | GPU time used on a wait or other blocking event. For example, the GPU is blocked waiting for a Fence. |
 |
Dark blue box | CPU sample. |
 |
Vertical maroon line | Context switch. |
Event Lists
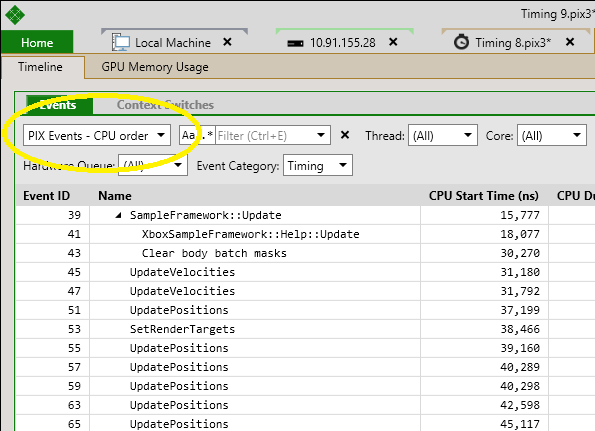
Timing captures support multiple event list views. The CPU Order event list builds hierarchies for PIX events based on the order the events were executed on per individual thread. The GPU Order event list builds hierarchies based on the GPU start time of each event. The Function Calls event list shows the CPU samples that were collected, and the functions that were tracked, while the capture was running.
By default, the Event Lists contain columns for start time, end time, duration and so on. The Counters button can be used to change the set of columns displayed in the Event Lists.
Use the dropdown in the upper left corner of the view to choose which hierarchy you’d like displayed in the Event List.
Callstacks for context switches
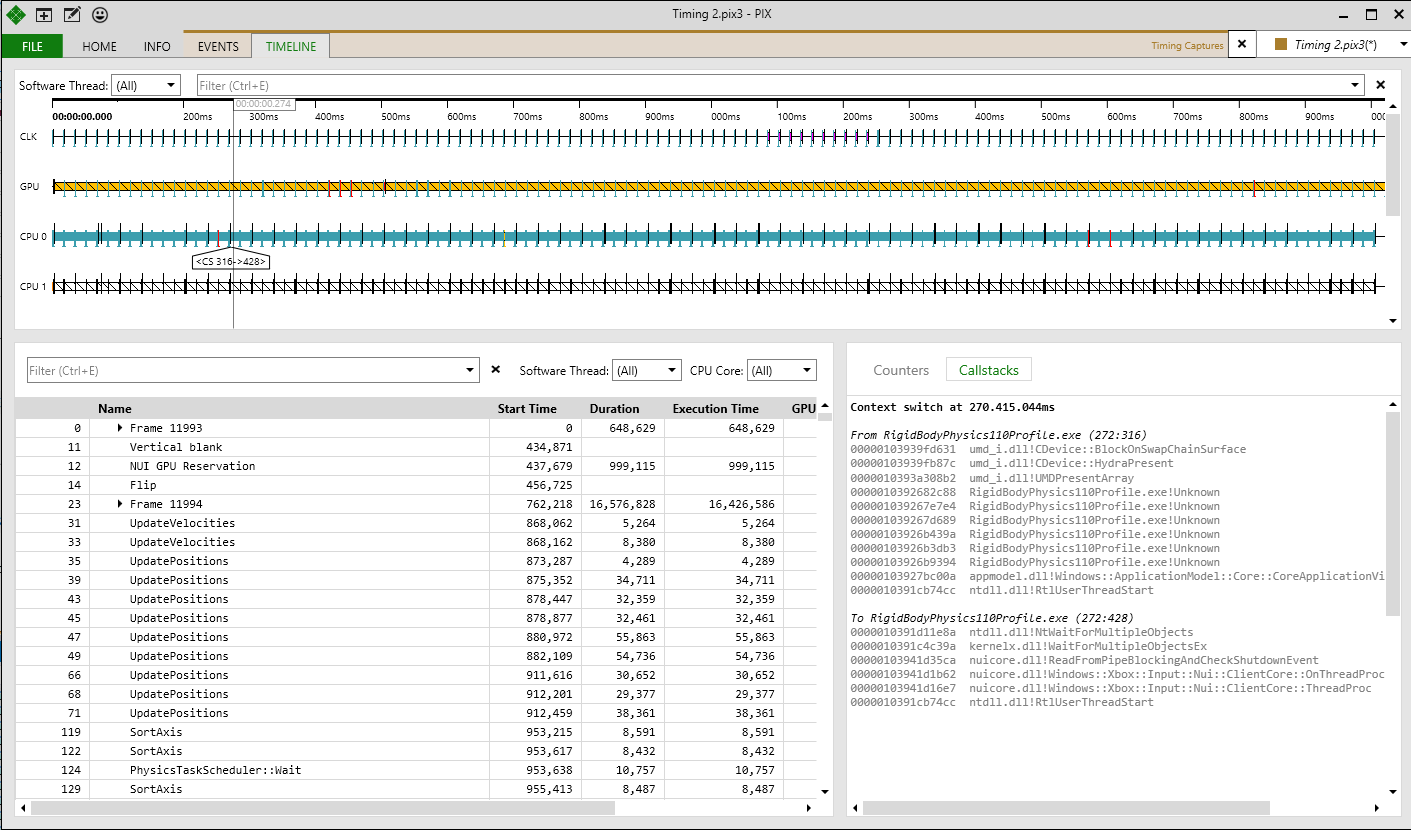
Timing captures can also provide you with the callstacks for context switches. Both the stack for the thread that got swapped out (“from” thread) and the stack that was swapped in (“to” thread) are displayed.
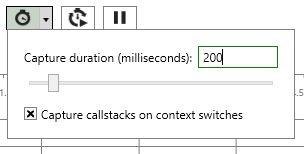
To see the callstacks for context switches you must select the Capture callstacks on context switches option before taking a capture. This option can be selected either in Settings or on the options pane under the Timing Capture button on the Home tab.
After taking a timing capture, select a context switch in the timeline. When a context switch is selected, the Callstacks view is updated to contain the “from” stack and the “to” stack.
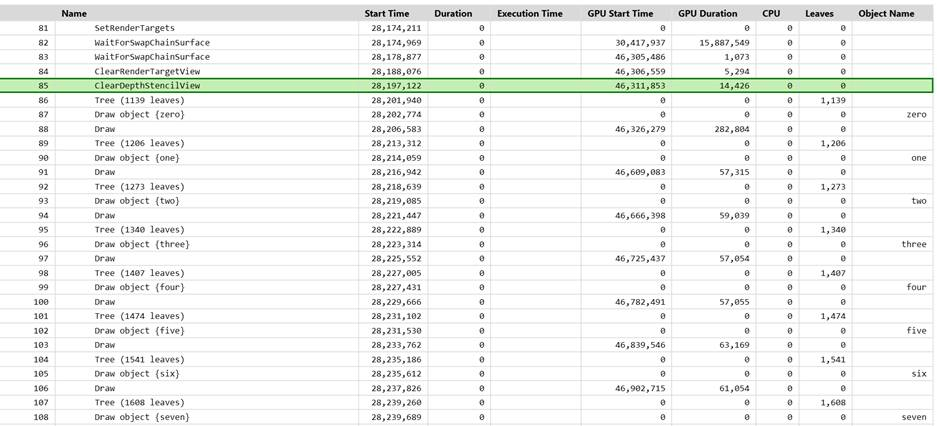
Extracting a Column from the Event Name
Data from the event name can be pulled out into a separate column, which may make it easier to examine. Use PIXBeginEvent or PIXSetMarker to embed the values, with delimiters if necessary:
        PIXSetMarker(PIX_COLOR_DEFAULT, L"Tree (%d leaves)", numLeaves);
        PIXSetMarker(PIX_COLOR_DEFAULT, L"Draw object { %s }", objectName);
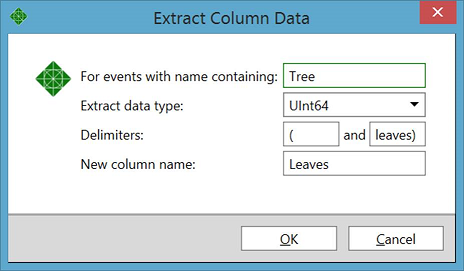
After creating a timing capture, right-click in the Events view and select Extract column data from event name. In the dialog box, fill in the requested details:
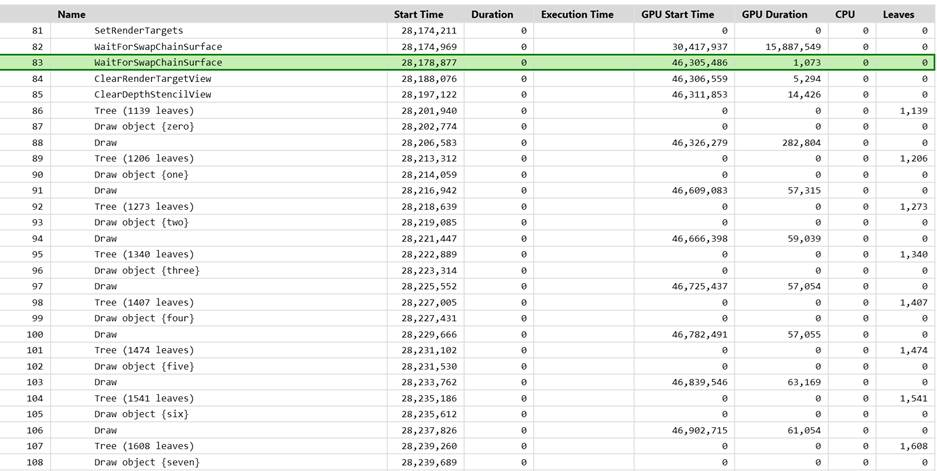
The new column will appear with the requested data:
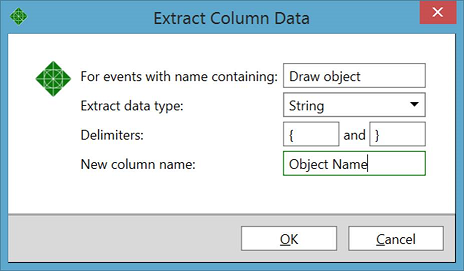
String values can be extracted, too:
Event Tracing for Windows data in Timing Captures
PIX captures Event Tracing for Windows (ETW) data during a timing capture in order to display CPU activity. This ETW data is saved into the .PIX3 file when a timing capture file is saved. In some cases, it is valuable to inspect the original ETW data directly using Windows Performance Analyzer (WPA) and other Windows ETW-based performance tools. To support this, PIX leaves the original ETL file on the Xbox console at XD:\XBPERF\PixSTCETW_u.etl - this file can be copied back to the development PC using File Copy (xbcp.exe) and then opened in WPA.
For more information on ETW data, refer to Event Tracing.
For more information on WPA, refer to Windows Performance Analyzer.
System Timing Capture Tutorial
This tutorial adds a single system timing capture to the Triangle application described in Simple Triangle.
- Write the simple triangle app described in Simple Triangle, if you have not done so already.
- Make the app PIX enabled by following the steps in PIX Setup and Getting Started.
- Include the header file pix.h, and link to the library PIXEvt.lib.
- Locate the Tick method in the app, and change it by adding a PIXBeginEvent and PIXEndEvent call as follows:
// Executes basic game loop. void Game::Tick() {PIXBeginEvent(PIX_COLOR(255,255,255), L"Render Loop timing"); m_timer->Update(); Update(m_timer->Total, m_timer->Delta); Render();PIXEndEvent(); } - Compile and run the app in Debug mode. Set the IP address of the Xbox One console if necessary.
- Ensure that the triangle is being rendered correctly on the Xbox One console. If not go back and check all the proceeding steps.
- Open up PIX on the development PC, and select Create Timing Capture from the Capture menu.
Figure 6. Enter the capture time.1. After a short wait while the data is transferred, the timing captures should appear.
Figure 7. Select one of the “Render Loop timing” calls to highlight it on the timing chart.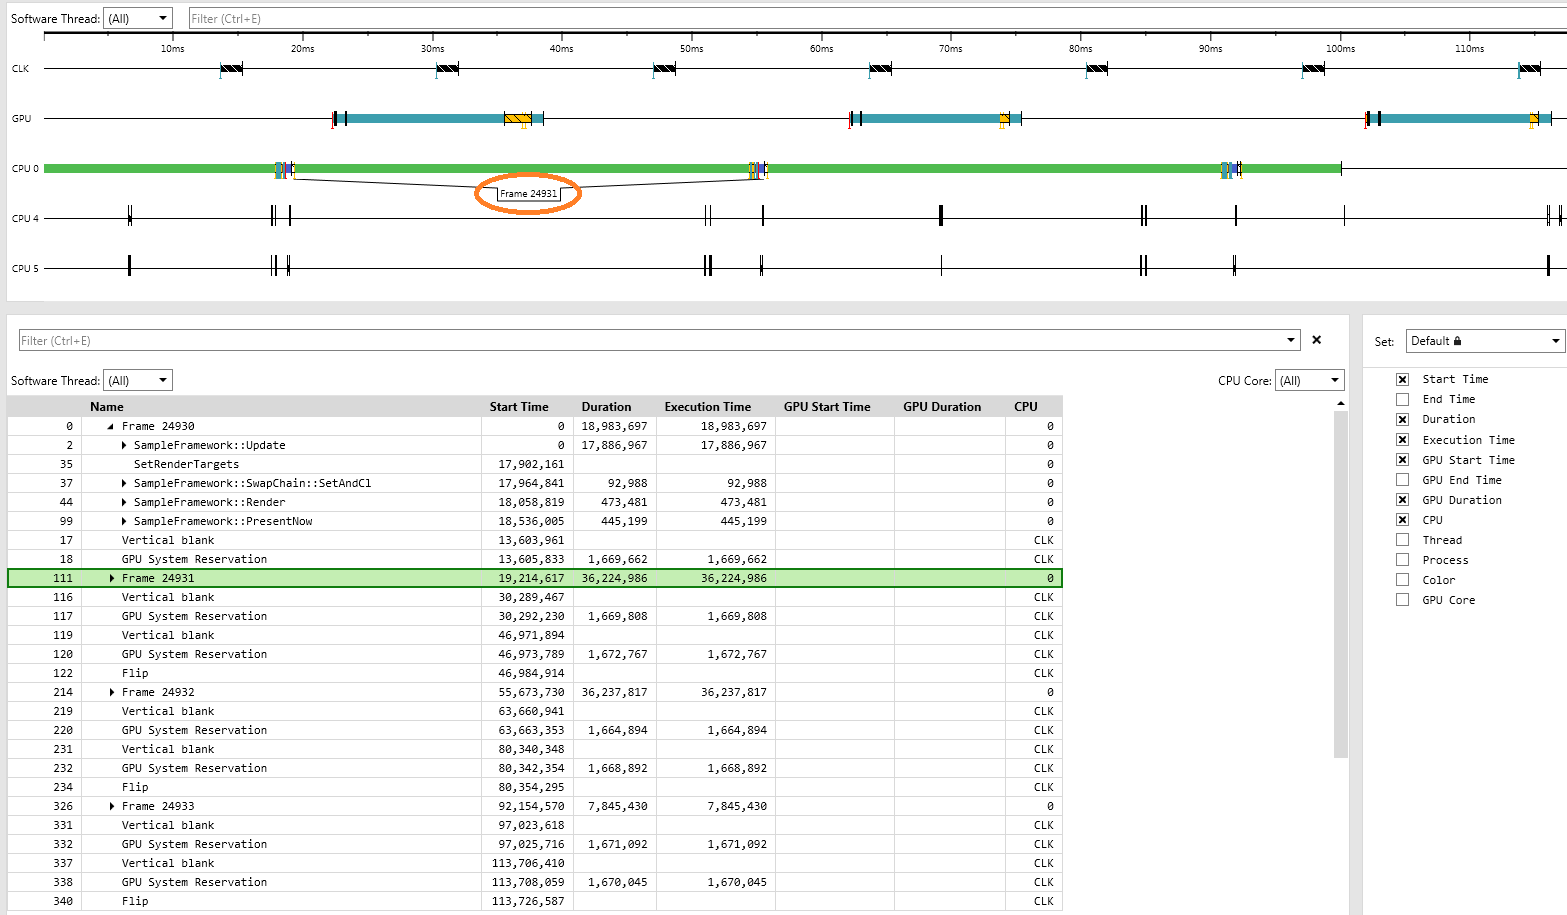 1. Hover over the rectangle in the timing chart to bring up a little more information.
Figure 8. Start time and duration in nano-seconds.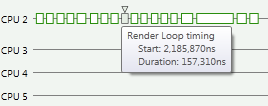 1. A marker can be added anywhere in your code using PIXSetMarker, but lets add a marker between the Update and Render calls, and adding the m_timer->Delta float variable to the output text.
// Executes basic game loop. void Game::Tick() { PIXBeginEvent(0xfffffffPIX_COLOR(255,255,255), L"Render Loop timing"); m_timer->Update(); Update(m_timer->Total, m_timer->Delta);PIXSetMarker(PIX_COLOR(255,0,0), L"Update-Render split %f", m_timer->Delta); Render(); PIXEndEvent(); }- Compile and Run the updated program.
- Select Create Timing Capture from PIX again, and examine the events.
Figure 9. Expand the events by clicking on the small arrow marker.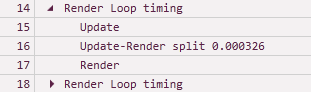 1. Right-click on the time scale and select Zoom In a few times if the time intervals are short.
Figure 10. A marker has a start time but no duration.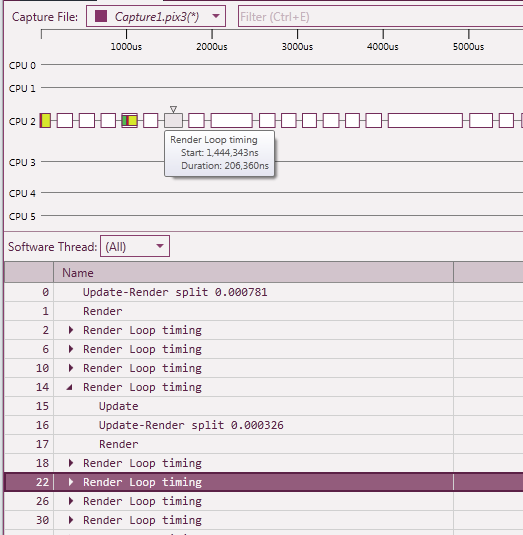 1. As more system timing captures are made, they can be distinguished in the timing chart by setting different colors. The color for any event or marker can be set by the user with the PIX_COLOR, or a different color will be selected by the system depending on an arbitrary index that you set with the PIX_COLOR_INDEX.
 - That completes the timing capture tutorial. Save the capture files off for later analysis, if required.
White Papers
See also
Using PIX for general title performance
Collecting CPU Samples in Timing Captures